
also read : EURGBP Price Forecast: The Big Fall Will Start Soon 2 SEP 2025
Introduction
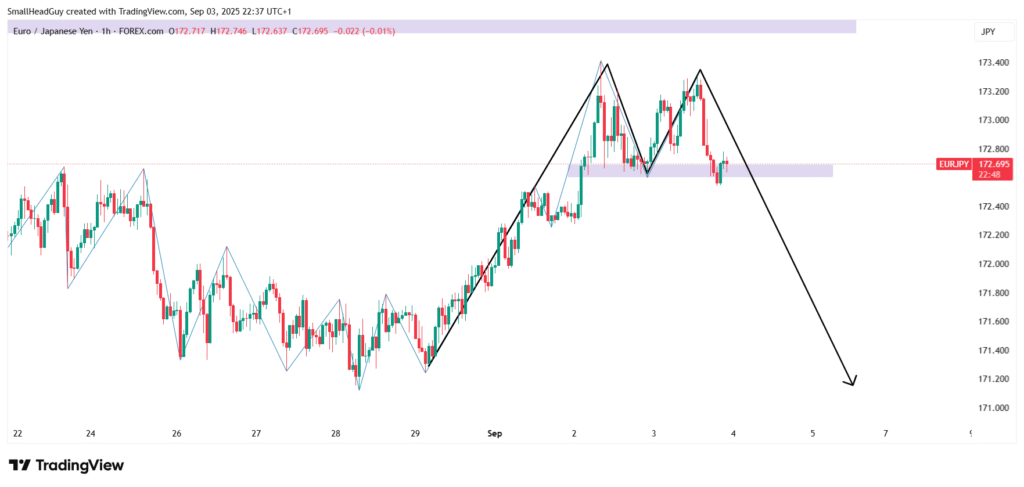
The EURJPY currency pair is approaching a critical technical level, and traders are closely watching for signs of a possible bearish reversal. Price action suggests the formation of an M-pattern, a classic chart formation that often signals the end of bullish momentum and the beginning of a downward move.
For this setup, the key level to watch is the midpoint of the M-pattern at 172.600. Confirmation of the bearish outlook will come once price stabilizes below this level. Until then, short-term rallies toward 173.100 could provide potential selling opportunities.
EURJPY Technical Outlook
Daily Time Frame
On the daily chart, EURJPY has shown strong bullish momentum over recent weeks, supported by euro strength and relatively weaker yen fundamentals. However, current candlestick formations are starting to show exhaustion at the highs. The emergence of an M-pattern on this timeframe raises the possibility that the bullish trend may be nearing its peak.
A break below 172.600 would shift the structure into bearish territory, confirming that sellers are taking control.
4-Hour Time Frame
The 4-hour chart provides further detail. After testing recent highs, price has struggled to break higher with conviction. The pair is showing signs of divergence between price and momentum indicators, hinting that bullish strength is weakening.
If EURJPY rises to 173.100, traders should watch for bearish candlestick patterns, such as engulfing candles or shooting stars, to confirm rejection from resistance.
1-Hour Time Frame
On the 1-hour chart, price is consolidating just above the critical midpoint at 172.600. This area acts as the line in the sand. A decisive breakdown, followed by stabilization below this level, will signal a shift from bullish to bearish bias.
Key Support and Resistance Levels
- Immediate Resistance: 173.100
- Critical Resistance: 173.500
- Midpoint of M (Confirmation Level): 172.600
- Immediate Support: 171.900
- Extended Support: 170.800
The zone between 172.600 and 173.100 is the most important area to monitor. If the pair fails to sustain above this zone, the bearish case becomes stronger.
The M-Pattern Setup
The M-pattern is a reversal formation that appears after an extended bullish trend. It consists of two peaks, separated by a corrective dip (the midpoint).
- First Peak: Recent highs around 173.100
- Midpoint: 172.600
- Second Peak: Current retest of resistance
The setup becomes valid if price breaks below 172.600 and holds. Once that happens, the M-pattern completes, signaling potential downside acceleration.
also read : NZDJPY Forecast bulls taking control 29 AUG 2025
Trading Strategy for EURJPY
Step 1: Watch for Retracement
Expect EURJPY to test 173.100 before giving a sell opportunity. This creates an ideal level to watch for rejections.
Step 2: Confirmation Below 172.600
The sell-side bias confirms only when price stabilizes below 172.600. A daily or 4-hour close below this level strengthens the bearish setup.
Step 3: Entry and Targets
- Entry Zone: 173.100 (rejection) or below 172.600 (confirmation)
- Stop Loss: Above 173.500 resistance
- Targets:
- First target: 171.900
- Second target: 170.800
- Extended target: 169.500 if bearish momentum continues
Fundamental Outlook
Euro (EUR) Side
The euro has recently been supported by resilient economic data, but the European Central Bank (ECB) remains cautious. Inflation is cooling, and policymakers are under pressure to balance growth risks with price stability. Any dovish commentary from the ECB could weigh on the euro, reinforcing a bearish EURJPY move.
Japanese Yen (JPY) Side
The Bank of Japan (BoJ) continues its ultra-loose monetary policy, but recent discussions have hinted at potential tweaks if inflation stabilizes above target. While JPY has remained weak due to yield differentials, any shift in BoJ tone could spark yen buying and push EURJPY lower.
Together, these factors create mixed fundamentals, but technical signals currently point toward a possible correction in EURJPY.
Risk Considerations
- If EURJPY breaks and sustains above 173.500, the bearish outlook weakens, and price could move toward 174.200.
- Strong euro-positive news or unexpected dovish signals from the BoJ could invalidate the bearish M-pattern.
- Traders should adjust risk management and avoid entering trades without confirmation below 172.600.
Summary: EURJPY Bearish Reversal in Play
- Pattern in Focus: M-pattern forming on the daily chart
- Critical Level: 172.600 (midpoint)
- Sell Opportunity: Watch for rejection near 173.100 or breakdown below 172.600
- Targets: 171.900, 170.800, extended 169.500
- Bias: Bearish, once price confirms below 172.600
The EURJPY price forecast suggests that bears may soon take control. The pair is testing critical resistance, and the formation of an M-pattern highlights the risk of reversal. Traders should stay patient, wait for confirmation, and look for sell setups below 172.600 to align with the broader bearish structure.
also read : EURCHF Price Forecast: Bulls Eye 0.95200 After Breakout 1 September