Scroll Down For ID
read previous audusd report : AUDJPY Price Forecast: Quick Sell-Off from Current Resistance Before Breakout 9 September 2025
The AUD/USD currency pair is presenting traders with a complex but tradable structure. On higher time frames, such as the weekly chart, the overall trend remains bearish, with a sequence of lower highs that reflects the longer-term weakness of the Australian dollar against the US dollar. However, when narrowing the focus to the daily and intraday charts, the structure looks far more constructive for buyers. Short-term momentum favors the upside, and key support levels continue to hold. This creates a situation where traders can maintain a bullish bias in the near term while respecting the fact that the broader market structure is still tilted downward.
Macro and Fundamental Landscape
The Reserve Bank of Australia (RBA) currently holds its cash rate at 3.60%. Inflationary pressures in Australia have moderated from their earlier peaks, allowing the central bank to pause its tightening cycle. While markets had priced in the possibility of further cuts this year, the most recent communications from the RBA suggest a cautious “wait and see” approach. That pause gives the Australian dollar some breathing room, especially when compared to the policy outlook for the US Federal Reserve.
On the other side of the pair, the US dollar has softened in recent weeks. Softer employment data and increasing market bets on future rate cuts have put the Federal Reserve in a less aggressive position than earlier in the cycle. As rate differentials begin to narrow, the Australian dollar finds relative support. In addition, global risk sentiment has stabilized, which often benefits higher-yielding currencies like the AUD.
China remains a critical factor. As Australia’s largest trading partner, any slowdown in Chinese economic performance has an outsized effect on the Australian dollar. Recent Chinese retail sales and industrial production data came in weaker than expected, highlighting subdued external demand. Even so, the market has not seen aggressive selling in AUD/USD, suggesting that investors are balancing these concerns with expectations of stronger domestic demand and continued support for commodities such as iron ore, which underpin Australia’s trade balance.
Daily Chart: Short-Term Bullish Structure
The daily chart shows a clear bullish structure. Price is trending above the nine-day exponential moving average, and short-term momentum indicators remain supportive of further upside. The pair is trading inside an ascending channel that has guided price action for several weeks. The lower boundary of this channel sits near the 0.6560–0.6600 area, while the upper boundary aligns with resistance around 0.6680–0.6700.
Momentum oscillators confirm the bullish view. The Relative Strength Index (RSI) is holding around 58–60, a level that signals strength without reaching overbought territory. The Average Directional Index (ADX) is rising, showing that the trend is not only intact but also gaining strength. Moving averages further support the bullish narrative, with shorter-term averages such as the MA50 and MA100 trending below current price, providing a cushion for pullbacks.
The Fibonacci retracement drawn from recent swing highs to swing lows aligns with the 0.69600 zone, which marks a significant confluence of resistance. This region represents the next major upside target, and traders should anticipate potential exhaustion or reversal if price reaches this zone.
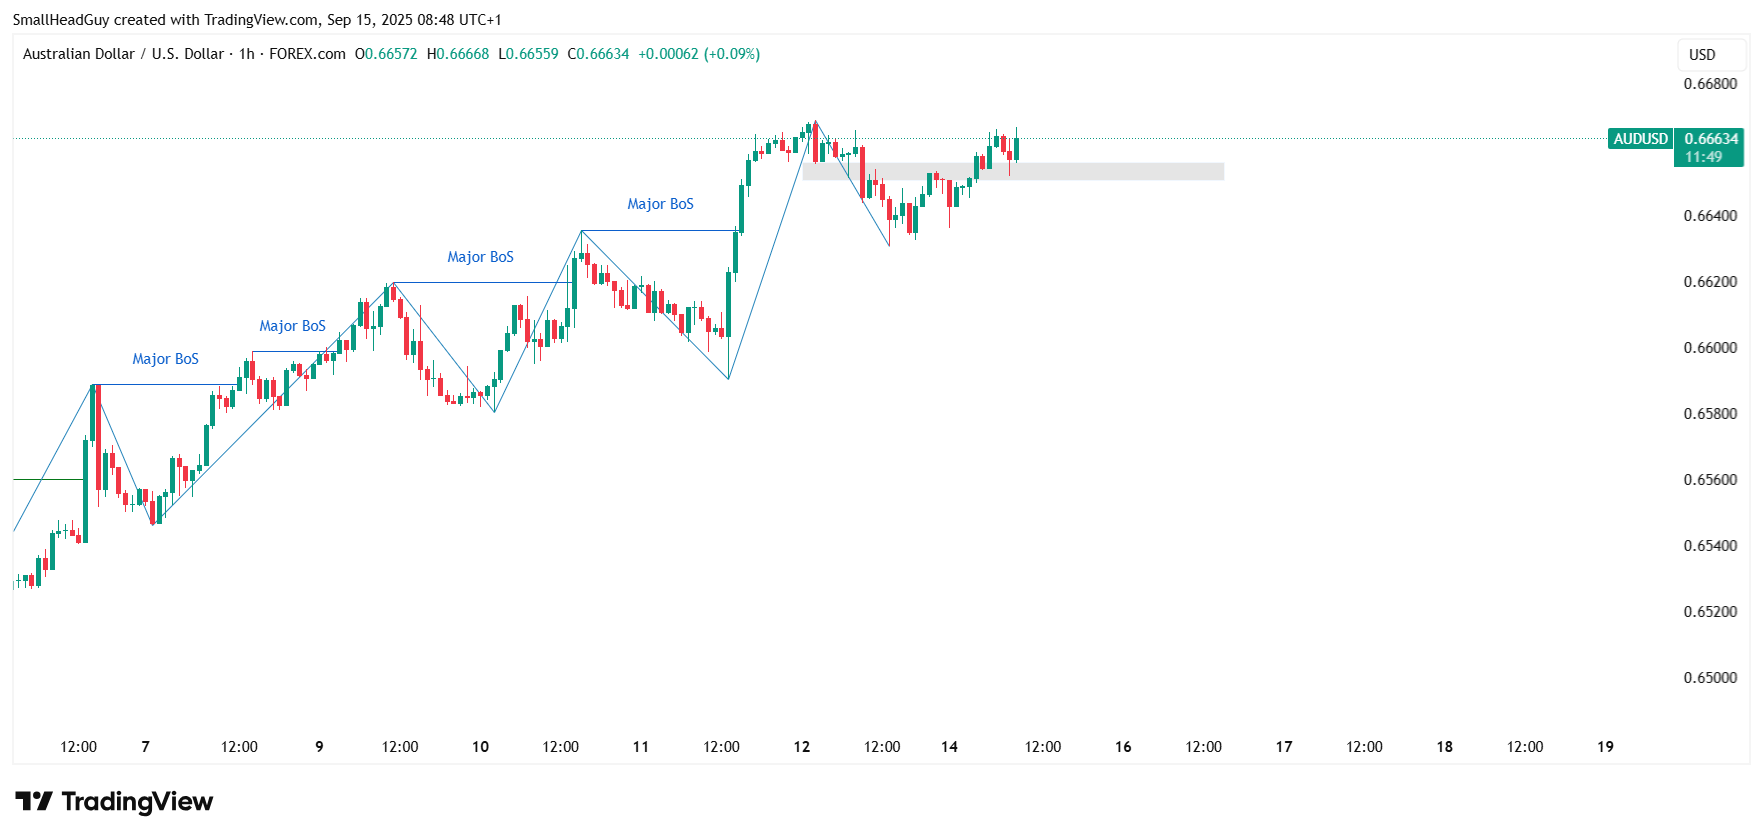
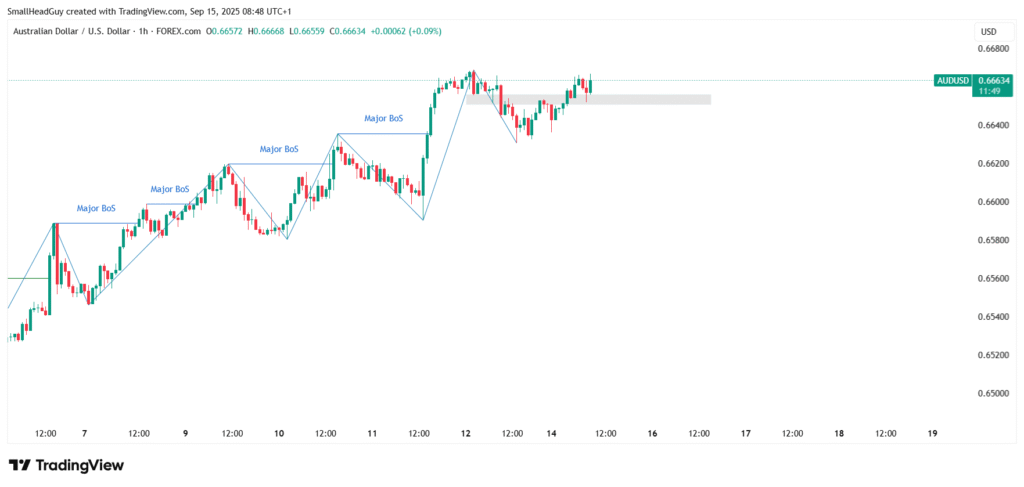
Hourly and Intraday Chart: Holding Above 0.66500
The hourly chart reinforces the bullish case. Price action continues to make higher highs and higher lows, and as long as AUD/USD holds above the 0.66500 level, the bias remains upward. Short-period moving averages on the intraday chart, combined with a rising Parabolic SAR, highlight sustained buying interest. Volume profiles suggest that demand is strong around the 0.66500–0.6670 zone, which now acts as a key support base.
If the pair were to lose this level decisively, the bullish structure would weaken, exposing price to deeper pullbacks toward the lower boundary of the daily ascending channel. But until such a breakdown occurs, buying dips above 0.66500 remains the more favorable strategy.
Weekly Chart: Broader Bearish Framework
Despite bullish signals on shorter time frames, the weekly chart tells a different story. The pair continues to operate within a long-term bearish structure characterized by successive lower highs. This implies that the upside seen on the daily and hourly charts may simply represent a corrective phase within the broader downtrend. Long-term sellers will likely view the 0.69600 resistance area as a prime zone to re-engage, especially since it coincides with a major Fibonacci level.
This tension between the weekly and daily time frames creates the mixed picture currently observed in AUD/USD. Traders must therefore approach the market with flexibility, recognizing that short-term bullish opportunities exist but are ultimately capped by a larger bearish framework.
read more : AUDCAD Price Forecast Update Big Falls Starts Soon 6 SEPTEMBER 2025
Additional Indicator Bias
Beyond the moving averages and RSI, the MACD on the daily chart has crossed into positive territory, reinforcing the bullish momentum. The histogram is expanding, suggesting that momentum is still building. Bollinger Bands show price hugging the upper band, a classic sign of trend continuation, though it also warns that volatility may expand if a reversal occurs.
Volume analysis highlights strong participation on up-moves compared to down-moves, signaling conviction among buyers. This supports the view that AUD/USD can continue to press higher in the short term. However, traders should monitor divergences—if momentum indicators start weakening while price makes new highs, that could foreshadow exhaustion near the 0.69600 zone.
Trading Scenarios
In practical terms, there are three clear scenarios for traders to monitor:
- Bullish Continuation: Price holds above 0.66500, momentum remains intact, and AUD/USD pushes toward the 0.69600 Fibonacci resistance. In this case, dip-buying strategies remain optimal, with stop losses placed just under the 0.66500 support.
- Bearish Reversal: Price stalls near the 0.69600 region, momentum indicators show divergence, and bearish candlestick patterns emerge. Sellers would then look for confirmation of a reversal, targeting 0.6700 initially and possibly lower if the weekly bearish structure reasserts itself.
- Neutral Consolidation: AUD/USD trades sideways between 0.66500 and 0.6800, reflecting indecision ahead of major economic releases such as RBA policy updates or US inflation data. In this scenario, breakout traders may wait for confirmation outside of this range before committing to new positions.
Conclusion
The outlook for AUD/USD is defined by a clash between short-term bullishness and long-term bearishness. Daily and intraday charts show a market that is still climbing, with buyers defending the 0.66500 support and aiming toward the 0.69600 resistance. Technical indicators—from moving averages to MACD and Bollinger Bands—are aligned with this bullish bias, giving traders reason to remain constructive in the short run.
Yet the weekly structure cannot be ignored. As long as lower highs dominate the larger picture, the broader trend remains bearish. The 0.69600 level should be viewed not only as a target but also as a potential inflection point where the longer-term sellers could regain control.
For traders, the key lies in balancing time frames. Buyers can exploit near-term momentum, but risk management is essential, especially as price approaches resistance zones. Sellers should remain patient, waiting for confirmation of reversal patterns before re-entering. With both fundamental and technical factors in flux, AUD/USD offers opportunity—but only for those disciplined enough to respect both the bullish short-term bias and the bearish long-term framework.
read more : EURCHF Price Forecast: Bulls Eye 0.95200 After Breakout 1 September