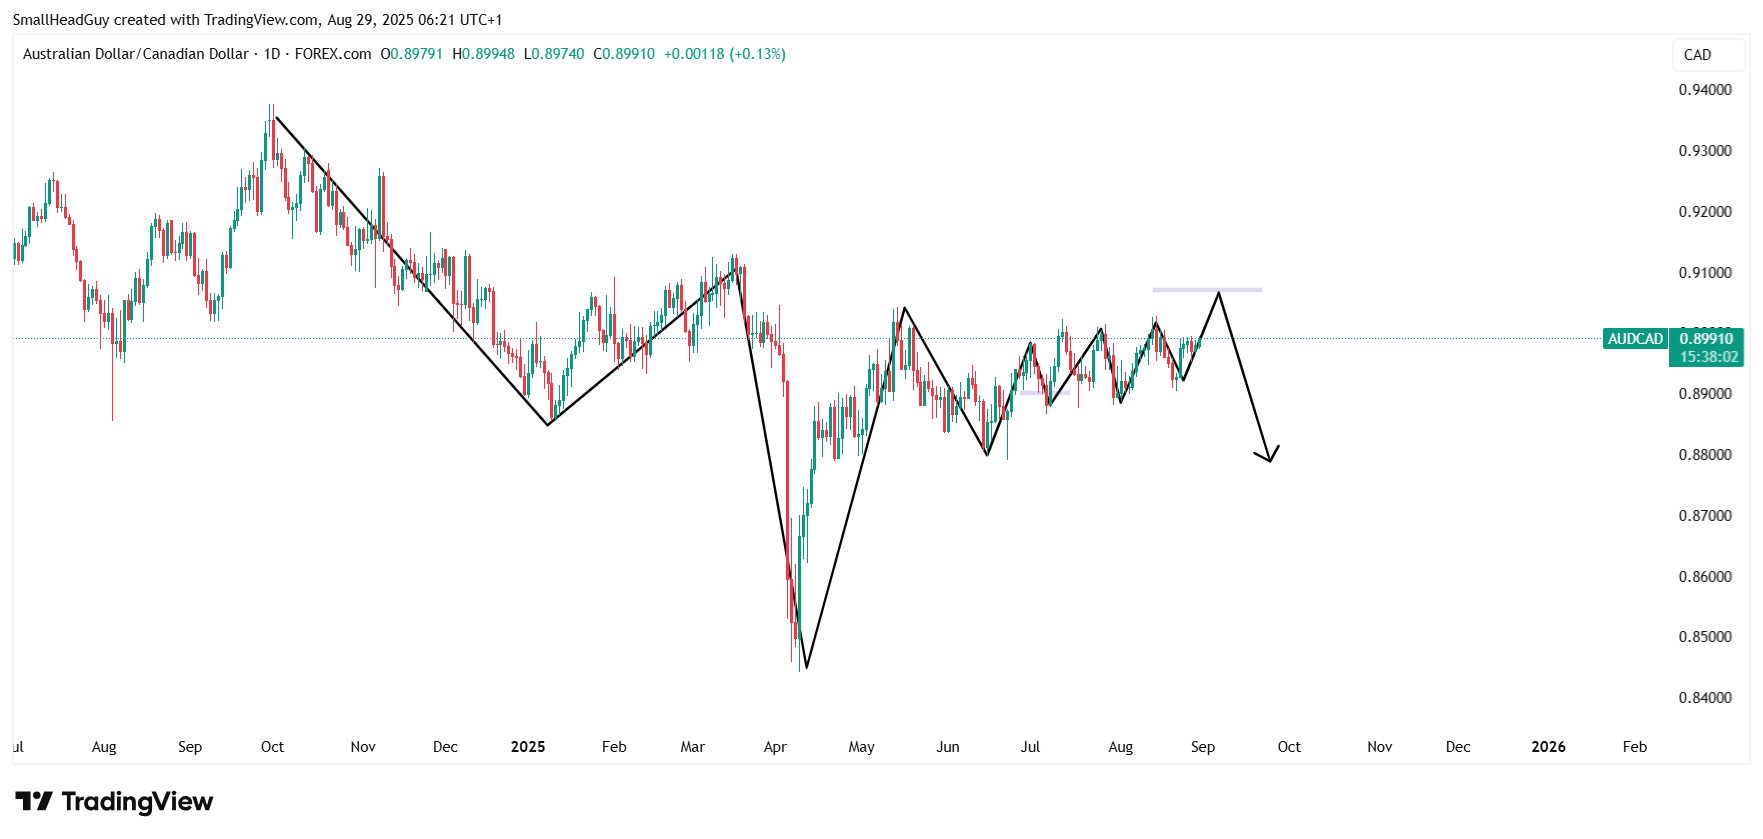

The AUDCAD currency pair has been consolidating on the daily time frame for several months, creating uncertainty about the next decisive move. While the short-term picture hints at a potential bullish breakout, the broader structure continues to lean bearish. Traders should pay attention to the key Fibonacci level of 0.90700, which will likely determine the next directional move.
Technical Outlook
Daily Time Frame: Consolidation With Bearish Bias
On the daily chart, AUDCAD has been trading sideways for months, creating a prolonged consolidation phase. Despite this lack of momentum, the broader structure remains tilted to the downside. Lower highs and lower lows on the longer-term chart reinforce the bearish bias, suggesting that rallies are more likely to be short-lived than sustained.
Four-Hour Time Frame: Signs of Upward Momentum
When we shift to the four-hour chart, momentum appears to be slowly turning bullish. Price has been creeping higher within the consolidation, and pressure is building for a potential breakout to the upside. If this breakout materializes, AUDCAD could extend its move higher before meeting major resistance.
The Key Level: 0.90700
The most important area to watch is 0.90700, which aligns with a critical Fibonacci retracement level. If the pair rallies into this zone, traders should watch carefully for bearish signals.
- A candle close below 0.90700 would indicate that bears are regaining control.
- That confirmation would align the shorter-term move with the dominant bearish trend on the daily chart.
- For risk management, stop-losses should be placed above the breakout high, while profit targets can be set at lower support zones such as 0.8900–0.8950.
Fundamental Drivers
Reserve Bank of Australia (RBA)
Monetary policy in Australia is currently leaning dovish. The Reserve Bank of Australia cut its cash rate to 3.60% in August 2025, the third reduction this year. Policymakers highlighted that economic growth is slowing and inflation remains largely under control. However, inflation surprised markets in July by spiking to 2.8%, which reduced expectations for immediate further easing.
- Markets now expect the RBA to cut rates again in November 2025, with additional easing possibly extending into early 2026.
- Overall, a softer monetary stance puts pressure on the Australian dollar, limiting its ability to sustain large bullish moves.
Bank of Canada (BoC)
The Bank of Canada, on the other hand, has held its policy rate steady at 2.75% since March 2025. While inflation in Canada has cooled significantly, the BoC has been cautious about cutting too quickly. Economists forecast that the central bank may deliver two more rate cuts before the end of the year, with the first move possibly coming in September.
- If the BoC does begin easing as expected, the Canadian dollar could weaken.
- This would lend some short-term support to AUDCAD, especially if paired with temporary bullish momentum on the four-hour chart.
Combined Technical and Fundamental View
When we combine technicals with fundamentals, a clear strategy emerges:
- Short-term outlook: AUDCAD may push higher toward 0.90700 on the back of CAD weakness and temporary bullish momentum.
- Medium- to long-term outlook: The broader bearish trend is likely to reassert itself once resistance is met. RBA’s dovish stance, combined with the longer-term bearish structure, suggests AUDCAD remains vulnerable to downside pressure.
Traders should therefore avoid chasing the upside move and instead prepare for short opportunities once the pair confirms rejection near 0.90700.
Trading Plan
- Wait for the rally: Allow price to approach the 0.90700 Fibonacci level.
- Look for bearish confirmation: Watch for candlestick signals such as engulfing patterns or a close below the level.
- Enter short positions: Only after confirmation that sellers are in control.
- Manage risk: Place stop-loss orders above the breakout high.
- Take profits: Target lower support areas within the 0.8900–0.8950 range.
Conclusion
AUDCAD is at a crossroads. On the one hand, the four-hour chart shows momentum building for a bullish breakout. On the other hand, the daily chart’s bearish structure and the Reserve Bank of Australia’s dovish monetary stance suggest that rallies are unlikely to last.
The 0.90700 Fibonacci level is the battleground where the next major move will be decided. If price rallies into this zone, traders should look for signs of reversal to position for a short trade aligned with the broader bearish trend. With the RBA expected to continue cutting rates and the BoC potentially easing later in the year, fundamental forces also point to limited upside and a market that favors selling rallies rather than buying breakouts.
In summary, patience is critical. The short-term bullish move could provide an excellent setup for medium-term bearish trades once AUDCAD confirms rejection at resistance.