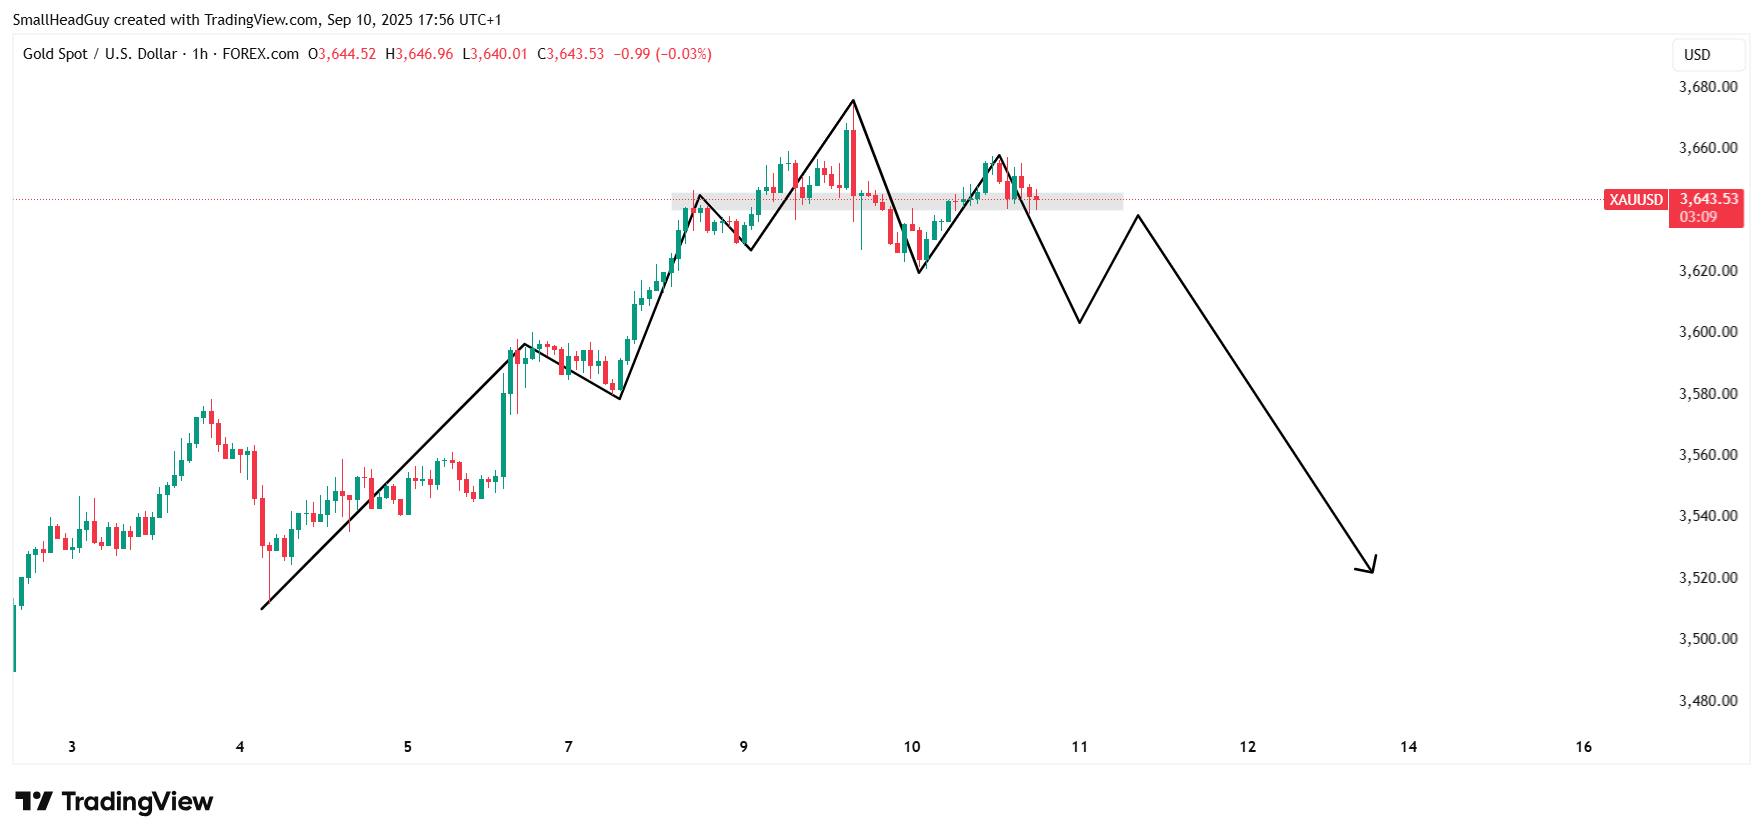

Scroll Down For ID
also read : EURGBP Price Forecast: The Big Fall Will Start Soon 2 SEP 2025
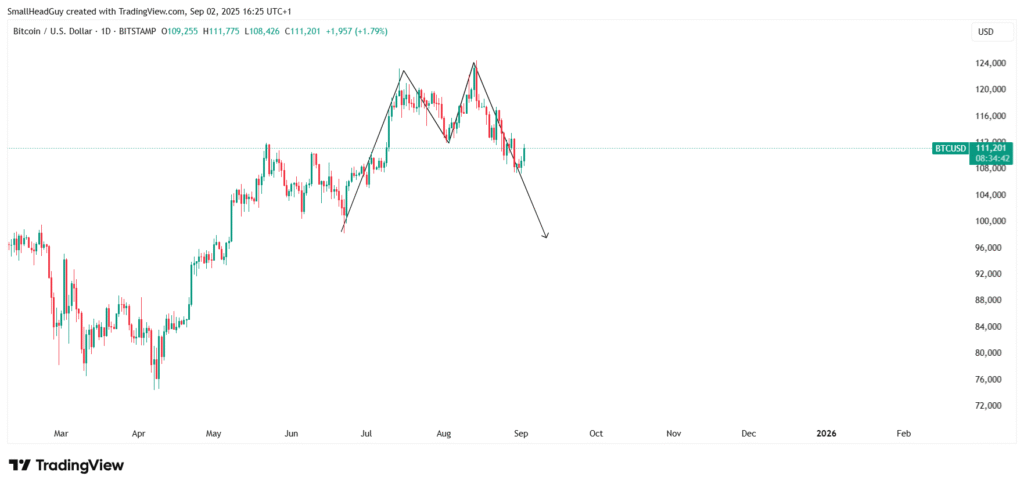
Introduction: Bitcoin Price Forecast Turns Bearish
Bitcoin’s price forecast is finally shifting as bears take control. After months of bullish momentum, the daily market structure has turned bearish. If this move continues, Bitcoin could fall below the $100,000 level, with key downside targets around $98,000 – $99,000.
In this article, we’ll break down the technical analysis, highlight major support and resistance levels, review a bearish M-pattern on the daily chart, and outline a clear trading strategy for Bitcoin’s next move.
Bitcoin Market Structure Analysis
On the 1-Day time frame, Bitcoin’s structure has shifted downward. This is important because Bitcoin has been trending bullishly for months. A break in daily structure usually signals that a larger trend reversal may be in play.
The bearish structure is confirmed by lower highs and lower lows, which suggest that sellers are starting to dominate the market.
Key Support and Resistance Levels for Bitcoin
Weekly Chart Levels
- Weekly Resistance 1: $119,300
- Weekly Resistance 2: $112,660
- Weekly Support 1: $108,250
- Weekly Support 2: $99,700
Daily Chart Levels
- Daily Resistance 1: $117,100
- Daily Resistance 2: $112,570
- Daily Support 1: $108,200
- Daily Support 2: $105,800
These levels are critical for Bitcoin traders. The resistances between $112,570 and $119,300 act as strong selling zones. Supports near $108,200 and $105,800 will be tested if the bearish momentum continues.
Bitcoin Price Forecast: The Bearish M-Pattern
On the daily chart, Bitcoin is forming a classic M-pattern (double top). This technical pattern often signals a bearish reversal.
- The projected target for this M-pattern aligns with the $98,000 – $99,000 zone.
- A break below $105,800 will increase the probability of Bitcoin reaching these levels.
This makes the M-pattern a key bearish signal for the current Bitcoin price forecast.
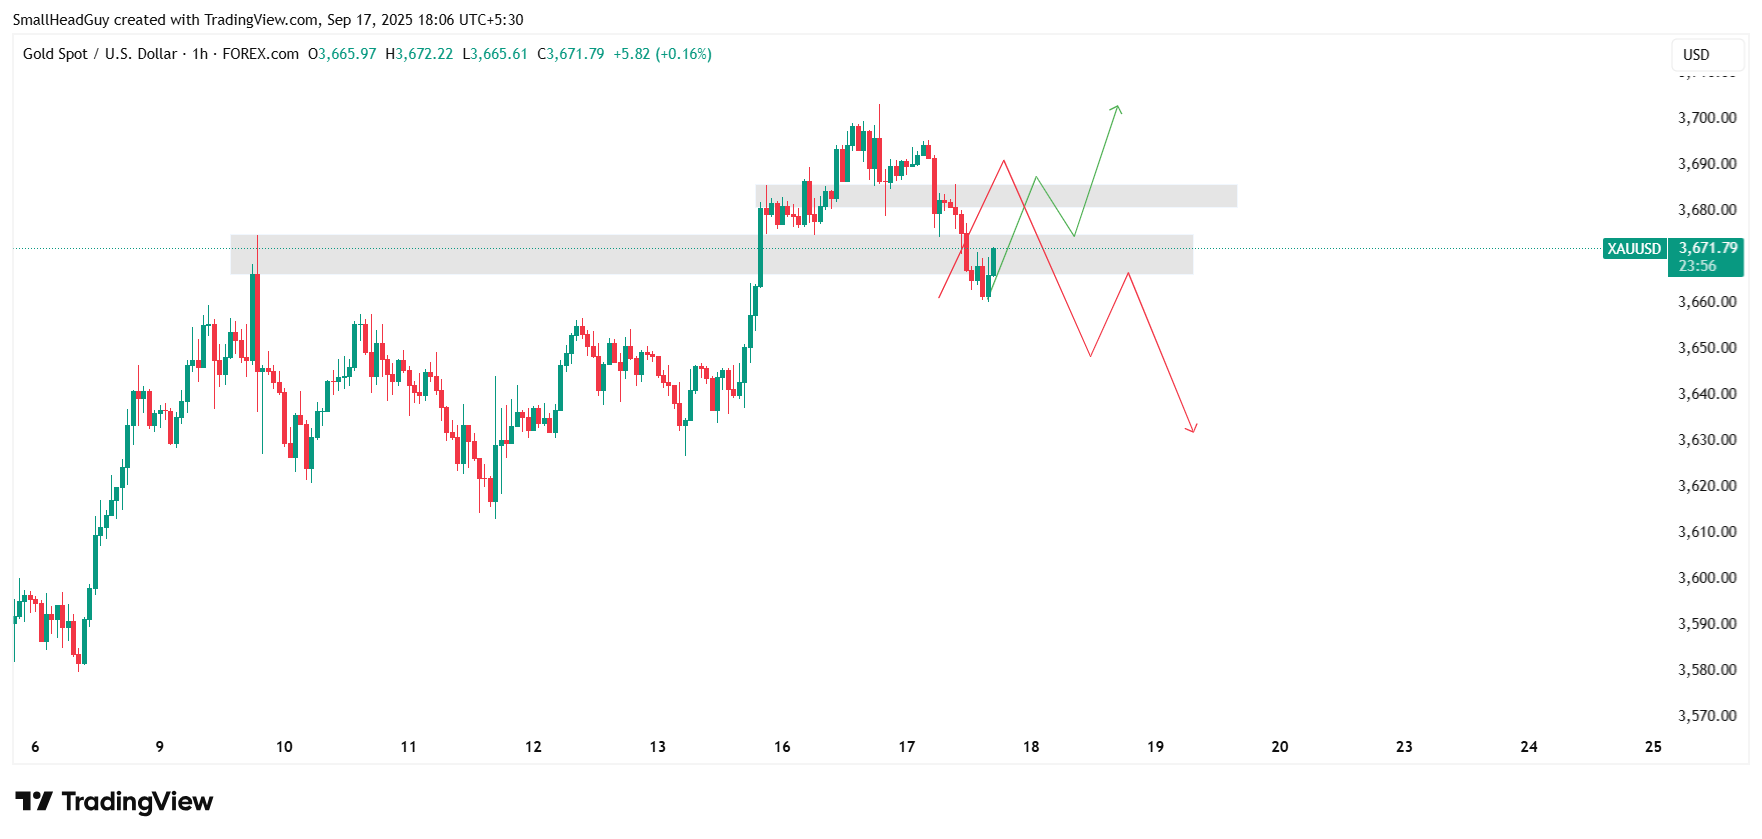
read more : NZDUSD Final Bullish Move Before a Big Sell-Off 28 AUG 2025
Bitcoin Trading Strategy: Selling at Resistance
The most effective strategy now is to sell at resistance zones:
- Watch $112,570 and $117,100 on the daily chart for bearish rejections.
- The weekly resistance at $119,300 is also a strong selling zone.
- Use bearish candlestick patterns (engulfing candles, pin bars, rejections) to confirm entries.
Targets should be placed near $108,200 first, then $99,700, and finally $98,000 – $99,000.
Fundamentals Impacting Bitcoin Price
While technicals dominate short-term moves, fundamentals also weigh on Bitcoin’s price:
- U.S. Dollar Strength: Rising Treasury yields and strong USD performance reduce demand for Bitcoin.
- Regulation News: Increasing regulatory scrutiny in the U.S. and Europe has weakened bullish momentum.
- Institutional Flows: Institutional inflows have slowed compared to earlier in the year, limiting upward potential.
These factors support the bearish Bitcoin price forecast.
Long-Term Bitcoin Price Forecast
As long as Bitcoin trades below $112,570 – $117,100, the long-term outlook remains bearish. A close below $105,800 could trigger a sharp sell-off toward $98,000 – $99,000.
Only a break and daily close above $119,300 would invalidate this bearish bias.
Conclusion: Bitcoin Bears in Control
The Bitcoin price forecast is bearish in the short to medium term. Key takeaways:
- Resistance Levels: $112,570, $117,100, $119,300
- Support Levels: $108,200, $105,800, $99,700
- Bearish Target Zone: $98,000 – $99,000
Traders should stay cautious and look for bearish setups at resistance levels. With the daily structure turning bearish and the M-pattern forming, Bitcoin could soon face its first significant correction in months.
read more : USDJPY Bearish Breakout: Fibonacci Levels, Consolidation, and Trading Strategy 27 AUG 2025