
Scroll Down For ID
read previous gold report : Gold Price Forecast: Bearish Engulfing on 1-Hour Charts Heralds Pullback Toward $3,600 10 SEPTEMBER 2025
Introduction to Gold Analysis
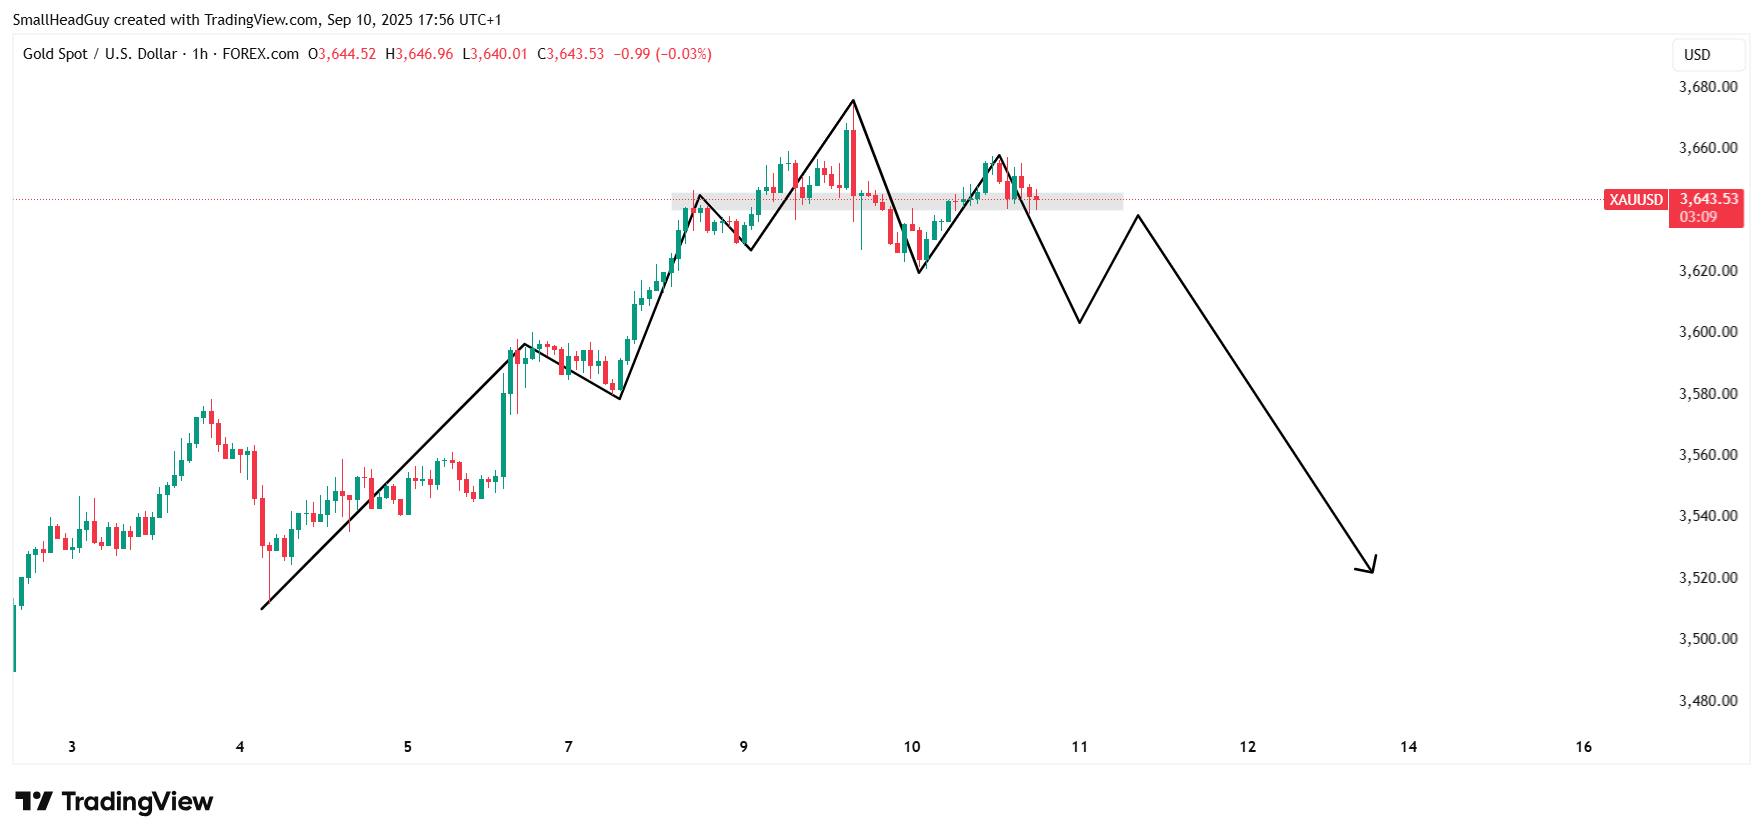
Gold has been one of the most actively watched assets in global markets, especially during 2025, as it trades near record highs above $3,600. The precious metal continues to attract investors due to economic uncertainty, inflation risks, and central bank policies. This Gold Analysis focuses on short-term technical structures and long-term fundamentals to give traders and investors a clear picture of possible scenarios.
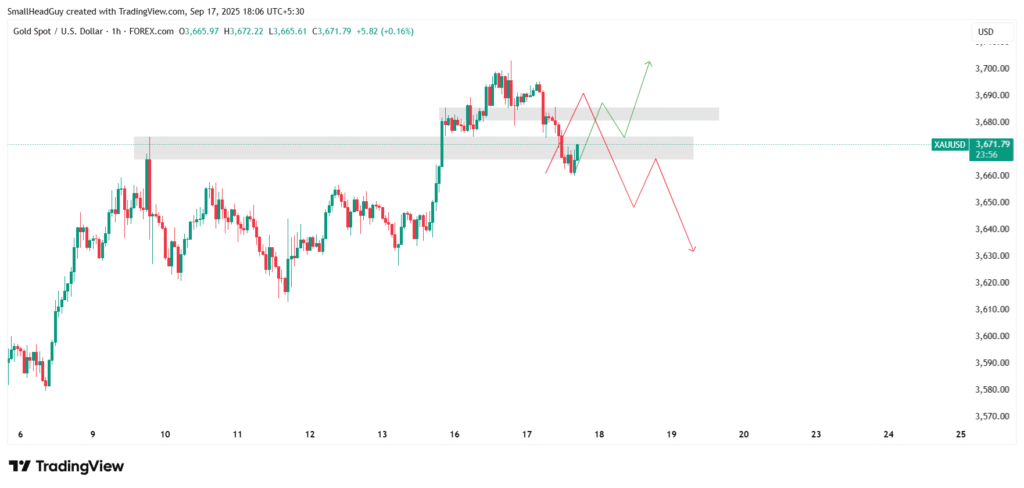
The chart highlights two important levels: 3660 as support and 3675 as resistance. Price movement around these levels will determine whether gold moves lower or pushes higher. In this detailed breakdown, we’ll combine technical indicators like RSI, MACD, moving averages, and Fibonacci retracement with fundamental drivers such as central bank decisions, inflation, and the U.S. dollar’s performance.
Gold Analysis on the Technical Side
Key Support and Resistance Zones
- Support at 3660: This zone has acted as a cushion in recent sessions. If gold fails here, downside pressure will increase, and the metal could slide toward 3640 or even 3620.
- Resistance at 3675: A clean break and sustained price above this level could open the door toward 3700 and beyond. Bulls need strong momentum and volume for confirmation.
Moving Averages
In this Gold Analysis, short-term moving averages (20-hour and 50-hour EMAs) show that gold is consolidating near key support. Price holding above these averages suggests momentum is still bullish. On the daily chart, the 200-day moving average remains far below current prices, confirming the long-term bullish bias.
Relative Strength Index (RSI)
RSI readings are in neutral-to-slightly bullish territory. This means there’s room for gold to rally further without entering extreme overbought conditions. If RSI climbs above 70 on the 1-hour or daily timeframe, traders should expect temporary pullbacks.
MACD Indicator
The MACD histogram is showing early signs of bullish crossover. If confirmed, it would support upside continuation above 3675. On shorter timeframes, however, MACD momentum appears weak, so traders must watch for divergence signals before committing to new positions.
Fibonacci Retracement
Drawing Fibonacci levels from the last swing low to swing high shows 61.8% retracement aligning near 3660. This strengthens the idea that 3660 is a pivotal level. As long as price stays above, bullish probabilities dominate.
Gold Analysis of Fundamental Drivers
Federal Reserve Policy
The Federal Reserve remains the most influential driver of gold. With policymakers expected to cut rates in late 2025, gold benefits as real yields decline. Lower interest rates reduce the opportunity cost of holding non-yielding assets, strengthening bullish sentiment.
Inflation and Real Yields
Sticky inflation continues to drive investor demand for gold. Even though inflation has cooled slightly compared to earlier peaks, it still remains above the Fed’s target. Real yields are under pressure, which historically boosts gold prices.
U.S. Dollar Performance
The U.S. dollar has weakened against major peers in recent weeks. A softer dollar makes gold cheaper for global buyers, fueling demand. If the dollar stages a rebound, gold could face short-term pressure.
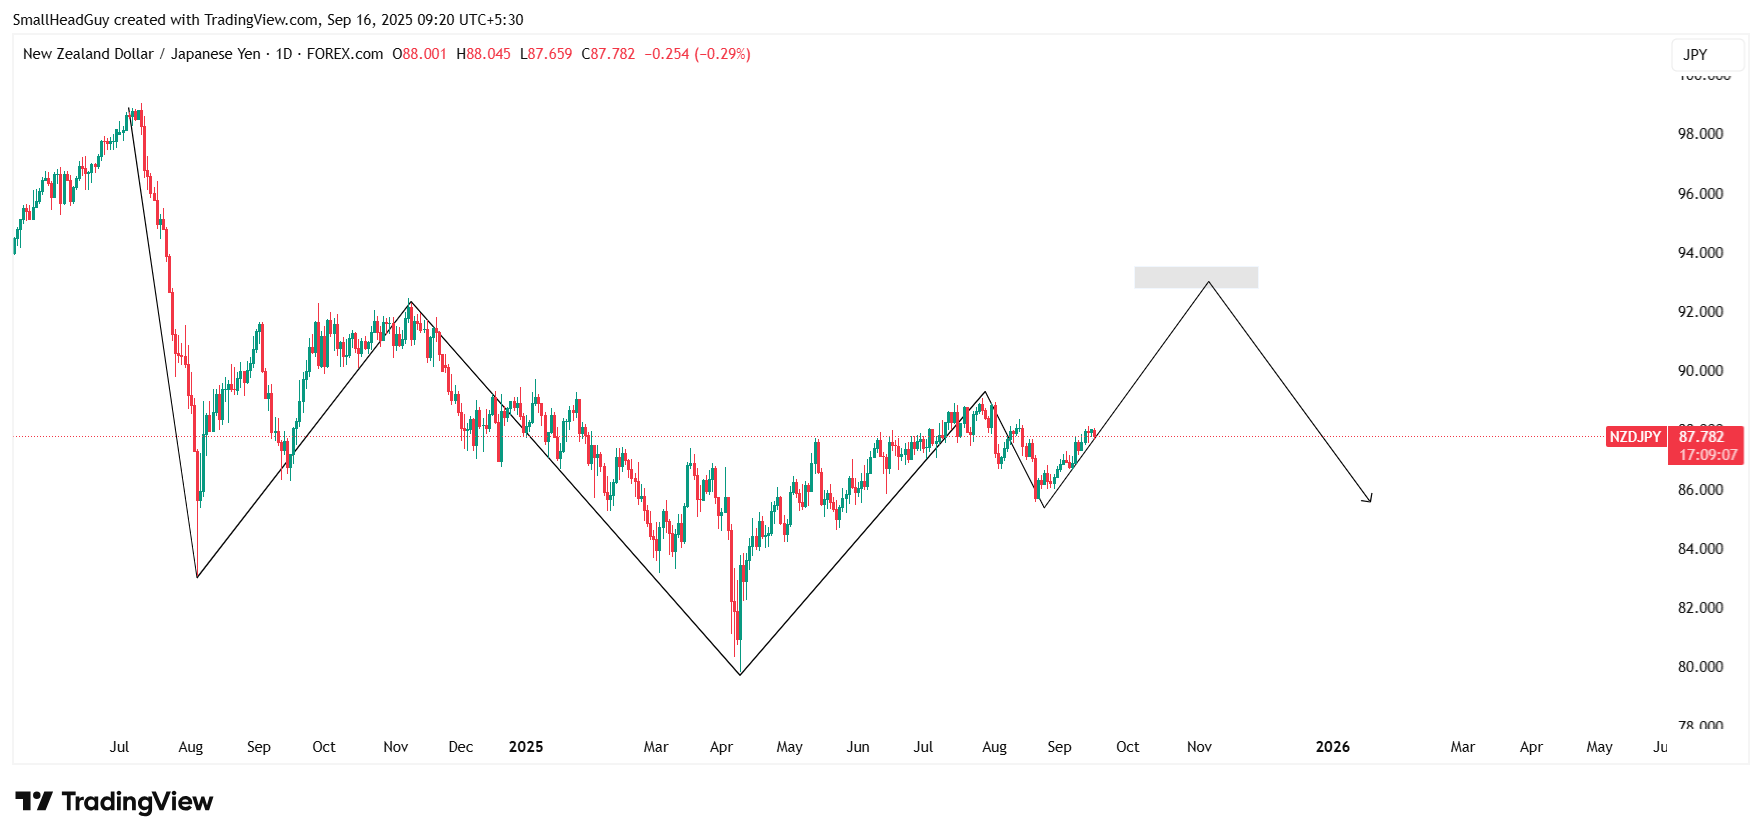
read more : NZD/JPY Technical Analysis: Short-Term Bullish Outlook With Weekly Target at 93.000 16 Sep 2025
Central Bank Buying
Global central banks, particularly in emerging economies, have been increasing gold reserves. This consistent demand acts as a strong floor for prices, preventing sharp declines even when speculative flows weaken.
Geopolitical Risks
Uncertainty in global politics—ranging from trade tensions to regional conflicts—keeps gold attractive as a safe-haven asset. Such factors can trigger sudden rallies, making gold an essential hedge.
Scenario 1: Bullish Breakout Above 3675
If gold breaks and sustains above 3675, bullish traders can expect momentum to extend toward 3700 and possibly 3720. Beyond that, record highs near 3750 could come into play. Volume confirmation and strong bullish candles are key signals to watch.
- Entry Point: Above 3675 on confirmation
- Target Levels: 3700, 3720, 3750
- Stop-Loss: Below 3660
Scenario 2: Bearish Breakdown Below 3660
A close below 3660 would confirm weakness. In that case, sellers could push the market toward 3640, 3620, or even deeper if fundamentals shift against gold. Bearish momentum often comes quickly once major supports are breached.
- Entry Point: Below 3660 on confirmation
- Target Levels: 3640, 3620, 3600
- Stop-Loss: Above 3675
Neutral / Range-Bound Outlook
If gold remains trapped between 3660 and 3675 without a decisive breakout, the market may enter consolidation. Range-bound strategies such as buying near support and selling near resistance could be effective in such conditions.
Additional Factors Supporting Gold Analysis
- ETF Demand: Gold-backed ETFs continue to see strong inflows, signaling long-term investor confidence.
- Mining Supply: Limited new discoveries and rising production costs restrict supply growth.
- Macro Data: Employment reports, inflation readings, and GDP figures from the U.S. regularly shift sentiment around gold.
- China and India Demand: Seasonal jewelry demand in these countries often influences short-term price moves.
Risk Factors to Watch
- Unexpected Fed Hawkishness: If the Fed delays rate cuts or signals further tightening, gold could see heavy selling.
- Surging Bond Yields: Rising U.S. Treasury yields reduce gold’s appeal as a safe haven.
- Stronger U.S. Dollar: A sharp rebound in the dollar index could limit upside potential.
- Reduced Geopolitical Tension: Any easing in global tensions might reduce safe-haven demand.
Conclusion: Final Gold Analysis Outlook
Gold sits at a critical juncture, with 3660 acting as key support and 3675 as vital resistance. The direction from here depends on whether bulls can defend support or break resistance with conviction.
- A bullish breakout above 3675 could target 3700-3750.
- A bearish breakdown below 3660 could pull prices toward 3620 or lower.
Fundamental conditions such as Fed rate policy, inflation, a weak dollar, and strong central bank buying currently favor the bullish case. However, technicals demand patience: confirmation is necessary before taking positions.
This Gold Analysis makes clear that traders must remain flexible, watching these levels closely while managing risk carefully.
also read : AUD/USD Technical and Fundamental Outlook: Bullish Daily Bias but Weekly Trend Remains Bearish 15 SEP 2025