
Scroll Down For ID
read more :NZDUSD Price Forecast: Retracement to 0.58900 Before the Next Fall 4 SEP 2025
Introduction
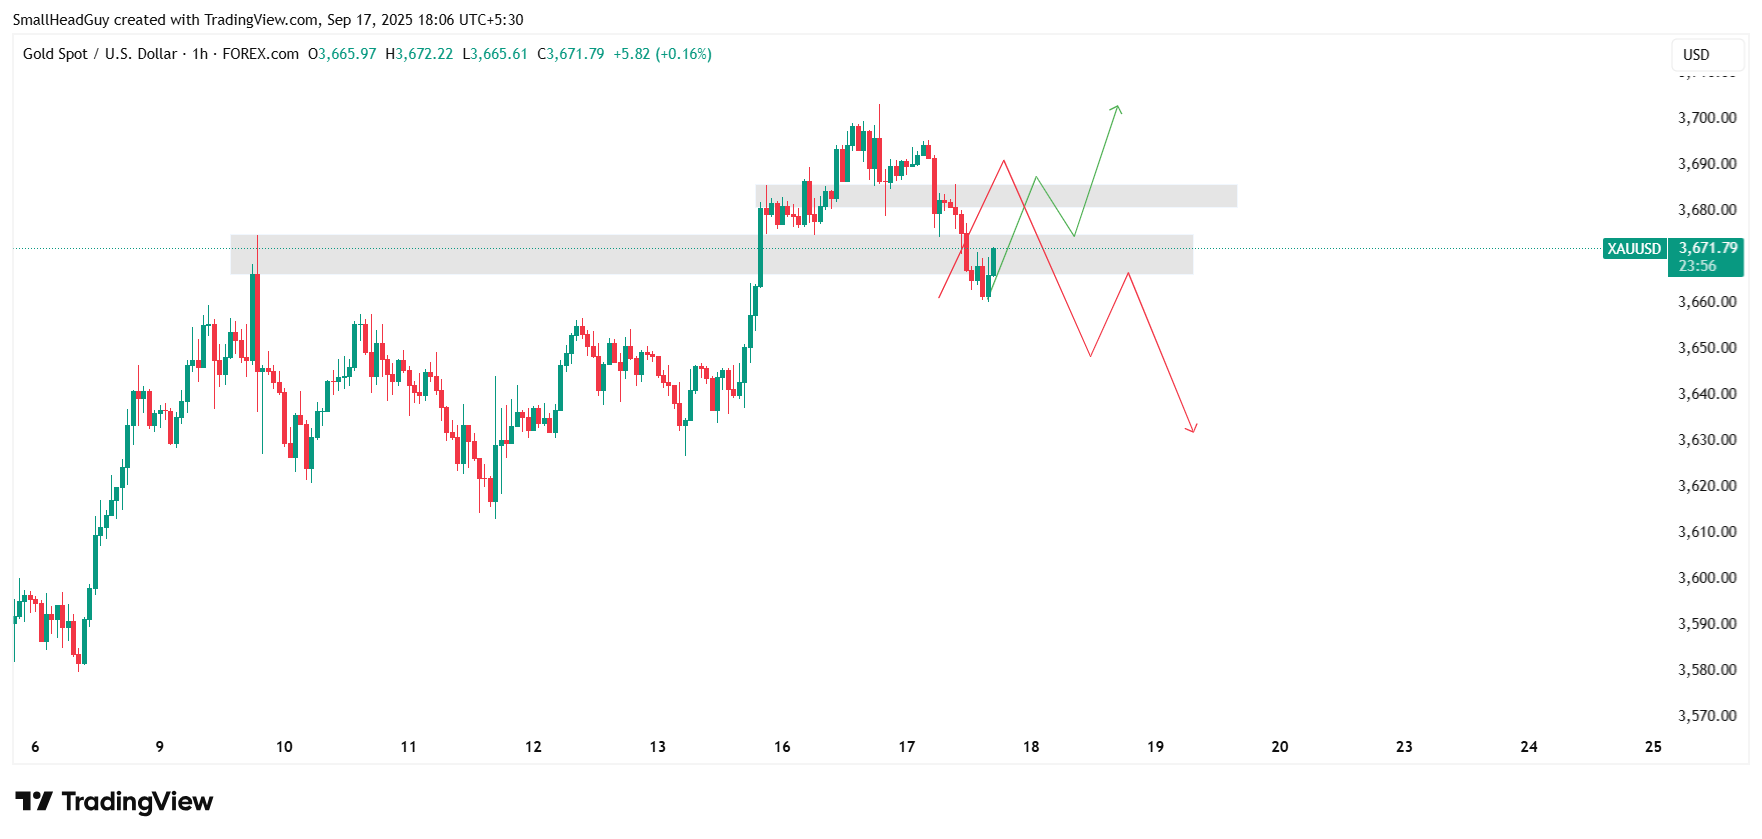
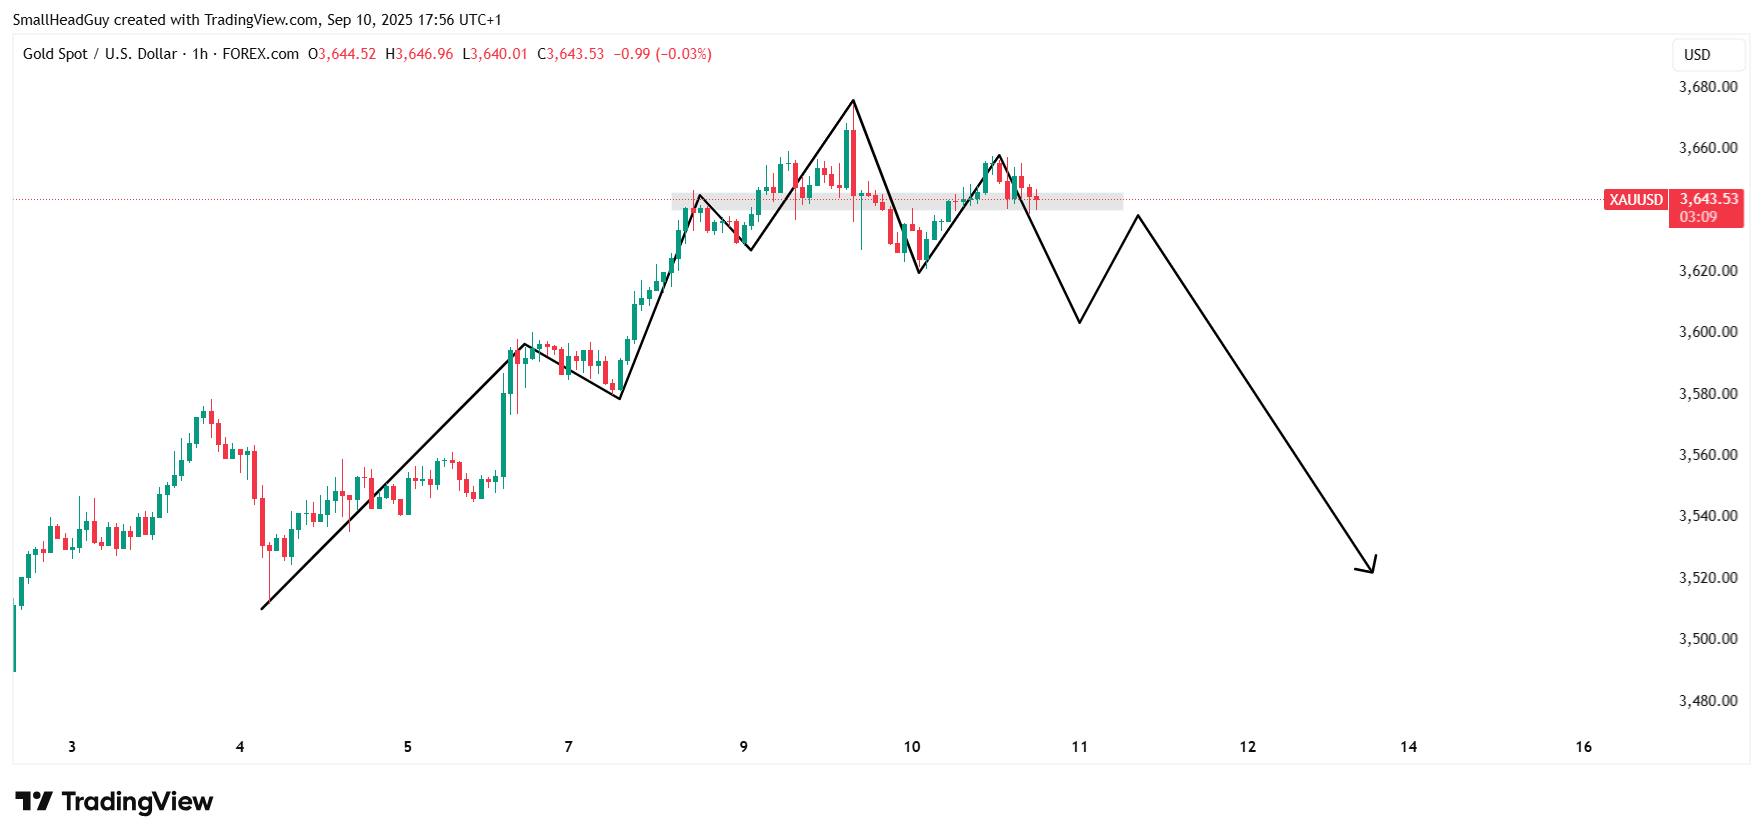
Gold (XAU/USD) has been on a strong bullish run in recent weeks, breaking fresh highs and drawing investor attention as global uncertainties push safe-haven demand higher. However, technical charts are now suggesting a short-term pause. On the 1-hour timeframe, a clear bearish engulfing candlestick pattern has emerged. This pattern often signals that sellers are stepping in to control the short-term price movement.
With this shift, we anticipate gold could retrace lower, with a projected target around $3,600 before potentially resuming its broader uptrend.
Technical Analysis
The 1-hour chart is critical for short-term traders. The appearance of a bearish engulfing candle—where a large red candle fully covers the prior green candle—indicates momentum is temporarily shifting in favor of bears. This usually triggers intraday sell-offs or corrective moves in price.
Key technical insights:
- Gold recently rallied to levels above $3,630–$3,640, showing strong bullish pressure.
- The bearish engulfing candle now suggests profit-taking by traders who bought earlier in the rally.
- Price is expected to test lower levels, with $3,600 as the next significant support zone.
- If the selling extends further, secondary supports could be seen around $3,580–$3,550 on the daily chart.
This setup implies that although gold remains bullish in the longer trend, a short-term correction is highly likely.
Larger Timeframe Structure
On the daily chart, the structure of gold remains bullish, supported by an ascending channel that has been in play for months. Pullbacks into support have repeatedly resulted in renewed buying pressure, which is consistent with strong institutional interest.
- Daily support rests near $3,550, aligning with the lower boundary of the trend channel.
- Immediate daily resistance lies near $3,640–$3,650, where sellers have capped prices multiple times.
- The current retracement is more likely a healthy correction rather than the start of a prolonged downtrend.
Thus, the bearish engulfing pattern on the 1-hour chart is a short-term event within a larger bullish narrative.
Momentum Indicators
Momentum tools are also supporting this correction:
- RSI (Relative Strength Index) on the 1-hour chart has been dropping from overbought conditions, pointing to a likely retracement.
- MACD is showing early signs of bearish crossovers, reinforcing the short-term downside outlook.
- On higher timeframes, both indicators remain supportive of bullish continuation, indicating the pullback may be limited in scope.
read more : Bitcoin Price Forecast: Bears Finally Taking Control (Targets $98K – $99K)
Fundamental Backdrop
Despite this short-term bearish signal, fundamentals for gold remain broadly supportive. The macro environment continues to favor higher gold prices in the long term.
Key drivers include:
- Federal Reserve Policy: Recent U.S. economic data has weakened, with job growth slowing and unemployment edging higher. This has increased expectations for Fed rate cuts in the coming months, which generally benefits gold by lowering opportunity costs.
- Central Bank Demand: Global central banks, particularly in emerging markets, remain aggressive buyers of gold to diversify reserves. This consistent demand provides a strong safety net for prices.
- Geopolitical Uncertainty: Persistent global political and financial tensions continue to drive safe-haven flows into gold.
- Inflation and Currency Volatility: Even though inflation has moderated, long-term concerns about monetary debasement continue to support the attractiveness of gold.
Price Targets
Based on current signals, the key levels to watch are:
- Immediate target: $3,600 — A major psychological and technical support zone.
- Secondary target: $3,580 — If bearish momentum strengthens, this zone may be tested.
- Stronger support: $3,550 — The lower boundary of the daily channel and an important buying level for trend continuation.
- Resistance levels: $3,630–$3,640 remain the first major ceilings to watch if prices bounce back.
Trading Outlook
For traders, the approach should be clear and structured:
- Short-term strategy: Watch for bearish continuation patterns below the engulfing candle on the 1-hour chart. If confirmed, target the $3,600 level as the first zone of interest.
- Swing trading strategy: Monitor price action near $3,600–$3,550. If bullish reversal patterns emerge in this area, it may provide excellent long setups for a continuation of the broader bullish trend.
- Risk management: Place stop-loss orders above the high of the engulfing candle to protect against false signals. Longer-term traders can keep wider stops below the $3,550 support zone to capture the bigger move.
Scenarios to Watch
- Bearish Short-Term Scenario
If momentum from the bearish engulfing candle continues, gold is likely to retrace to $3,600 and possibly extend to $3,580. - Bullish Continuation Scenario
Should gold stabilize near $3,600 and print bullish reversal signals, the next move could be a rally back above $3,640 toward fresh highs. - Invalidation Risk
If gold breaks above the engulfing candle high and sustains above $3,650, the bearish case will be invalidated, and buyers will likely regain full control.
Conclusion
Gold has been in a powerful bullish cycle, but the 1-hour bearish engulfing pattern is a red flag for short-term traders. The most probable outcome is a correction toward $3,600, where buyers are likely to reassess and re-enter the market.
In the bigger picture, fundamentals—such as central bank demand, Fed easing prospects, and global risk factors—still strongly support gold. This means the retracement should be viewed as a healthy dip within a bullish trend, rather than a complete reversal.
Traders should therefore be prepared for a two-step market move:
- A dip to $3,600 in the short term.
- A potential rebound back above $3,640 and beyond in the medium term.
Gold remains a market driven by both technical precision and strong macroeconomic narratives, and for now, the short-term pullback is part of a broader upward journey.
read more : AUDJPY Price Forecast: Quick Sell-Off from Current Resistance Before Breakout 9 September 2025