Scroll Down For ID
read our previous nzdjpy analysis: NZDJPY Forecast bulls taking control 29 AUG 2025
The NZD/JPY currency pair is showing an interesting mix of technical and fundamental signals. On the weekly chart, the overall structure remains bearish, but recent momentum is creating a short-term bullish correction. On the daily chart, buyers are in control, while intraday analysis shows important Fibonacci levels holding as support. With the weekly target set at 93.000, traders are watching for opportunities to buy as long as price action stays above key support levels.
Fundamental Overview of NZD/JPY
The Reserve Bank of New Zealand (RBNZ) recently cut its Official Cash Rate to 3.00%, the lowest level in three years. While inflation in New Zealand sits near 2.7%, it has begun to cool, giving the RBNZ room to act more dovish. Growth in New Zealand remains weak, with consumer spending and business investment softening.
The Bank of Japan (BOJ) continues to hold its policy rate at 0.50%, maintaining its ultra-loose monetary stance. Inflation in Japan remains modest, and policymakers have not signaled any major tightening in the near term. As a result, the Japanese yen remains pressured, and traders often use it as a funding currency for carry trades.
This contrast in central bank policies creates an environment where NZD/JPY can remain supported in the short term, despite New Zealand’s own economic challenges.
NZD/JPY Weekly Time Frame: Bearish Structure, Bullish Correction
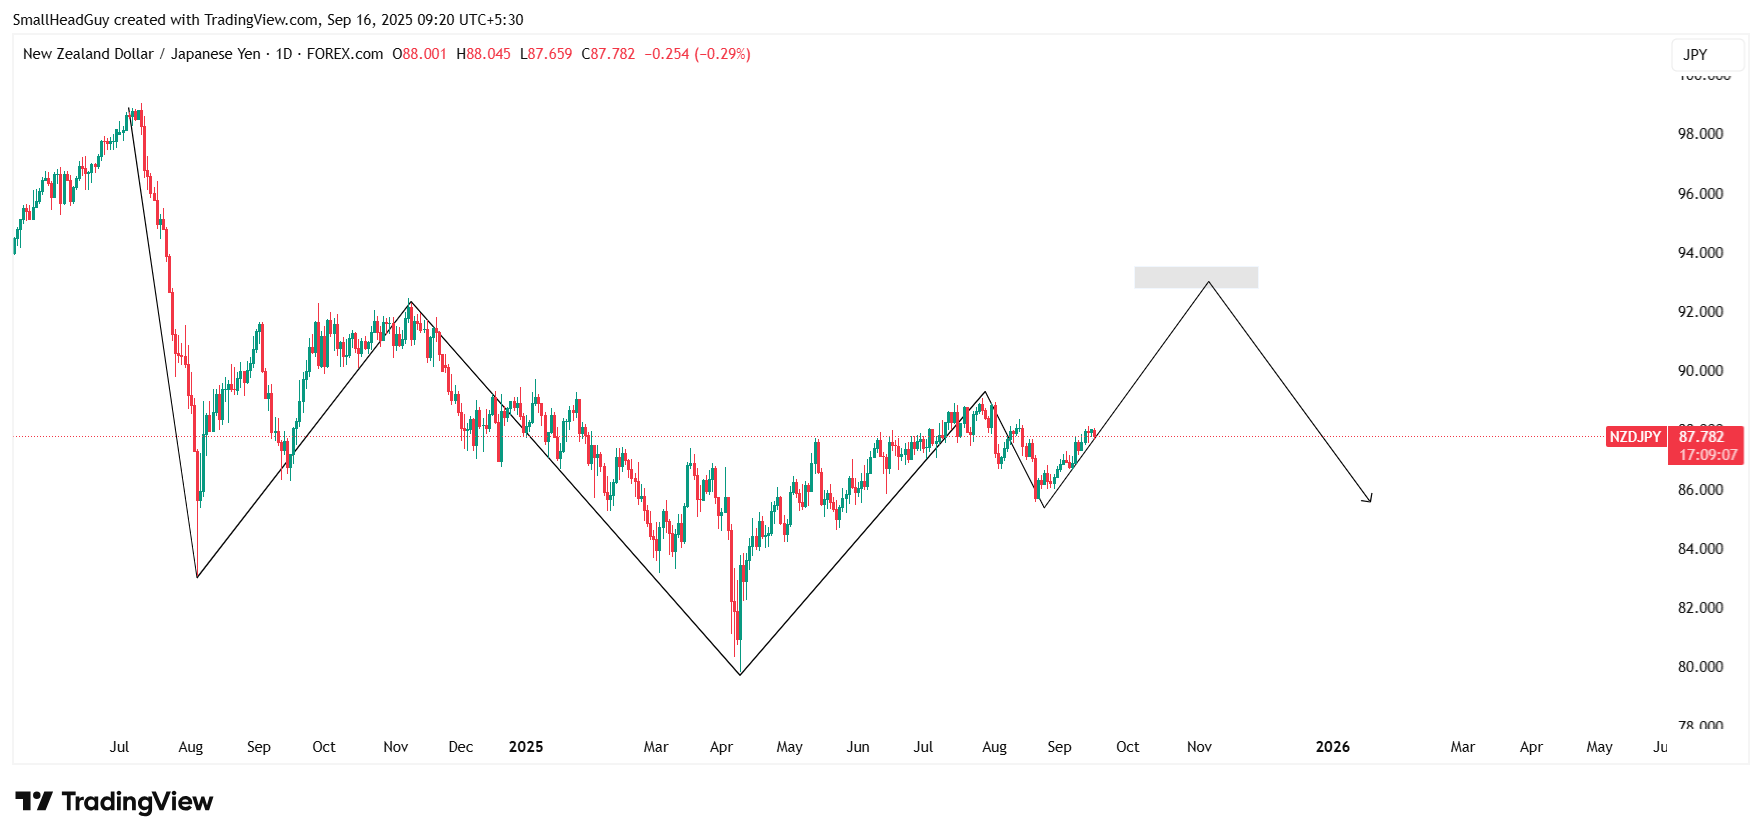
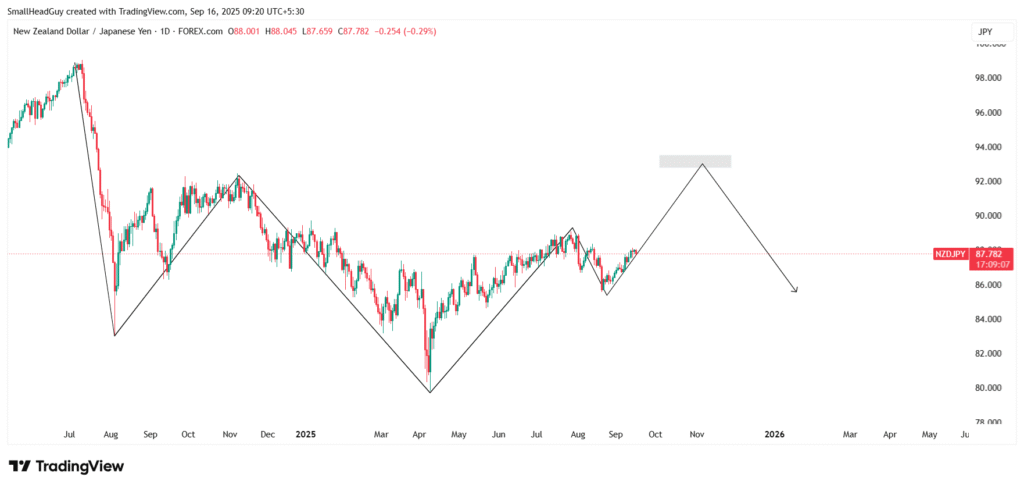
The weekly chart for NZD/JPY remains bearish overall, with a clear pattern of lower highs. This reflects the longer-term weakness of the pair. However, current price action is showing a rebound that could extend to 93.000, which aligns with a major resistance zone.
This move should be considered a bullish correction within the broader downtrend. Once price reaches the 93.000 level, the market could face significant selling pressure, as this zone has historically attracted strong resistance.
Daily Chart: NZD/JPY Bullish Momentum
On the daily chart, the structure is bullish. Price has broken above its 50-day and 100-day moving averages, confirming that buyers are dominating the short-term trend. The market is forming higher highs and higher lows, a classic bullish signal.
Momentum indicators add further confirmation. The Relative Strength Index (RSI) is holding around 60, suggesting upward momentum without overbought conditions. The MACD is in positive territory, with histogram bars expanding, which points to strengthening bullish momentum.
The next target on the daily chart aligns with the weekly resistance at 93.000. As long as price continues to trade above short-term moving averages, buyers remain in control.
Hourly Chart and Fibonacci Levels
On the one-hour chart, Fibonacci retracement analysis identifies 87.700 as a critical support level. This level has been tested and held, confirming its importance. As long as NZD/JPY remains above 87.700, traders should maintain a bullish bias.
Short-term moving averages, such as the 20-period EMA, are below current price levels and act as dynamic support. The Parabolic SAR is also pointing higher, while the ADX (Average Directional Index) confirms that trend strength is solid, sitting above 25.
If price dips toward 87.700 and rebounds with bullish confirmation, this creates an opportunity to buy into the trend, targeting higher resistance levels.
Key Levels for NZD/JPY
- Support: 87.700 (Fibonacci support), followed by 87.28 and 87.00
- Resistance: 89.00 in the short term, followed by the major weekly resistance at 93.000
These levels should guide trading setups, with stops placed below key support zones to manage risk.
read more : USDCAD Price Forecast: Pullback Expected Before Bullish Opportunity 15 September 2025
Technical Indicator Bias for NZD/JPY
A closer look at technical indicators strengthens the bullish case:
- Moving Averages: Daily MA50 and MA100 are below current price, providing support. Short-term EMAs on hourly charts are also aligned bullishly.
- RSI: Currently in bullish territory, showing room for further upside before overbought levels are reached.
- MACD: Shows a bullish crossover with rising histogram bars, reflecting building momentum.
- Bollinger Bands: Price action is pressing toward the upper band, a sign of bullish continuation, though traders should be cautious near resistance zones.
- ADX: Confirms strength of the ongoing uptrend, particularly on the intraday charts.
Trading Plan for NZD/JPY
The trading strategy for NZD/JPY should remain buy-focused above 87.700.
- Entry: Look for bullish setups on pullbacks above 87.700. Candlestick confirmations such as bullish engulfing or pin bars strengthen the case for entry.
- Stop Loss: Place stops slightly below 87.700 or recent swing lows to limit downside risk.
- Target: First target at 89.00, followed by 93.000 as the major weekly resistance.
This approach allows traders to take advantage of the short-term bullish momentum while respecting the broader bearish framework that dominates the weekly chart.
Risks to the Bullish Scenario
While indicators and price action support a bullish bias, traders should remain cautious of risks:
- RBNZ Dovish Policy: Further rate cuts from the Reserve Bank of New Zealand could weaken NZD.
- BOJ Policy Shifts: Although unlikely in the near term, any hint of tightening from the Bank of Japan could strengthen JPY.
- Global Risk Sentiment: If markets shift into risk-off mode, the yen could strengthen as a safe-haven, weighing on NZD/JPY.
- Economic Data Surprises: Poor GDP, retail sales, or employment data from New Zealand may undermine bullish momentum.
Conclusion
The NZD/JPY outlook is defined by short-term bullish momentum against a longer-term bearish backdrop. Weekly structure remains bearish, but price action is correcting higher with a clear target at 93.000. On the daily and hourly charts, technical indicators confirm strength, with the Fibonacci support at 87.700 acting as the key line in the sand.
As long as NZD/JPY trades above 87.700, buying setups are favored, with traders looking for profits around 89.00 and 93.000. Risk management remains essential, especially as price approaches major resistance zones where the broader bearish trend could reassert itself.
read more : AUDJPY Price Forecast: Quick Sell-Off from Current Resistance Before Breakout 9 September 2025