
read previous usdcad report : USDJPY Bearish Breakout: Fibonacci Levels, Consolidation, and Trading Strategy 27 AUG 2025
USDCAD is trading near an area of support on multiple timeframes. The chart suggests there may be a minor drop toward the 1.37200 zone before a bullish reversal sets up. Momentum and price action indicate potential weakness in the short-term, especially after a bearish engulfing candle on the daily timeframe. If price dips and then forms a valid bullish pattern around 1.37200, that may offer a promising long entry.
Technical Structure & Setup
- On the daily timeframe, a large bearish engulfing candle has formed, with a long wick pointing upward. This signals rejection of higher prices and suggests sellers are pushing back.
- Price recently has been consolidating above a support zone. This consolidation may precede a downward movement to grab liquidity below support.
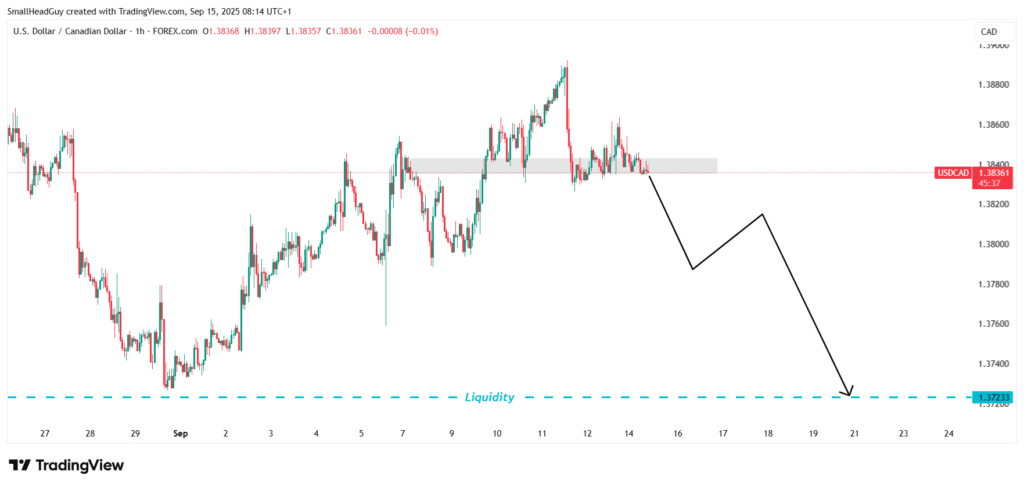
- Key support is identified around 1.37200. If price breaks below that, we expect sellers will press that weakness before a bounce.
- On the 1-hour timeframe, price is consolidating at an old support level. This level has acted as both support and resistance in earlier sessions. The lack of strong bullish follow-through at this support increases the probability of a drop.
- The pattern indicates: drop → test support (1.37200) → form bullish reversal → possible bullish break afterwards.
Price Levels & Targets
- Immediate Support Zone: ~1.37200
- Resistance Above: recent swing highs near 1.3840-1.3850 act as possible ceilings in short-term.
- Short-Term Target (if drop): 1.37200
- Reversal Entry Area: once price stabilizes below 1.37200 and shows bullish reversal structure.
- Upside Potential (if reversal): After reversal, possible move up toward the resistance ceiling around 1.3840-1.3850 or higher.
Fundamental Context – U.S. Central Bank & Canadian Bank Policies
To understand why USDCAD may drop toward 1.37200 before climbing, we need to look at what central banks are doing and how markets are feeling about their policies.
U.S. Federal Reserve (USD side)
- The U.S. Federal Reserve has held its policy interest rate steady in the 4.25%–4.50% range. No recent change in rate, but the rhetoric has been mixed. Markets are increasingly pricing in potential rate cuts in upcoming meetings due to signs of slowing in the labor market and weaker inflation pressures.
- Inflation data has cooled somewhat, though still above target. Jobless claims and labor data have shown weakness in recent weeks. This weak data increases expectation of easing.
- The Fed continues to communicate that any rate cut will be data-driven. Unless there is a strong inflation uptick, markets expect easing over the course of the rest of the year.
Bank of Canada (CAD side)
- The Bank of Canada currently holds its policy (overnight) rate at 2.75%. That rate was lowered earlier in the year but has been steady for some months.
- Inflation in Canada is relatively stable, near the bank’s target ranges, and economic growth is under pressure from trade headwinds and weak external demand. This gives less room for aggressive tightening.
- Oil price movements (important for CAD) provide partial support, but weaker domestic data and uncertainty over exports make CAD vulnerable if global demand softens.
read more : Bitcoin Price Forecast: Bears Finally Taking Control (Targets $98K – $99K)
Why USDCAD May Drop Before Moving Up
Putting technicals and fundamentals together gives the following scenario:
- With the daily bearish engulfing candle, we see likely short-term weakness. Sellers may push price down to the support around 1.37200.
- The U.S. side is under pressure: expectations of rate cuts, weak labor market signals, and inflation cooling. These reduce USD’s upside in the near term.
- The Canadian side is stable but not strong enough to offset USD weakness unless CAD receives positive data or oil prices spike.
Thus, price is likely to fall first, gather liquidity, then form a bullish reversal around 1.37200, after which buyers may regain control.
What to Watch For in Trading
- Monitor whether price breaks below 1.37200 decisively or just dips and returns above. A false breakout could trap sellers.
- Look for bullish reversal patterns at or below 1.37200 such as hammer or bullish engulfing on lower timeframes (1-hour or 4-hour). Confirmation via volume would be a plus.
- Watch U.S. economic releases: Non-farm payrolls, jobs reports, inflation, etc. Strong U.S. data could push USD up and invalidate the drop scenario.
- Keep eye on BoC commentary. If they signal further rate cuts or dovish tone, CAD could weaken, favoring USDCAD upside, but only after the drop.
Outlook & Summary
In summary:
USDCAD has shown signs of short-term bearish strength:
- A bearish engulfing candle on the daily timeframe with a long upper wick suggests rejection of higher prices.
- Price is consolidating on the 1-hour chart at a known support area, though not with strength.
Expectations:
- A drop toward 1.37200 seems probable.
- At that level or just below, wait for a bullish reversal pattern to confirm a potential long trade.
- If reversal holds, upward movement toward recent highs near 1.3840-1.3850 becomes possible.
Fundamentally:
- Fed is likely to cut rates sooner rather than later given weak employment and easing inflation; USD likely to soften in short term.
- BoC is steady with its policy, inflation roughly under control, but CAD not strong enough for sharp gains unless external demand improves.
Final Thoughts
USDCAD is likely to undergo a short squeeze downward before a potential rally. Traders should avoid entering longs now unless there is clear bullish confirmation near 1.37200. Bearish trades may be viable in the drop toward that support.
Once you see signs of reversal at 1.37200 (or slightly below), that may mark the setup for a more reliable long. Until then, price action suggests caution with a bias toward short positions in the short-term.
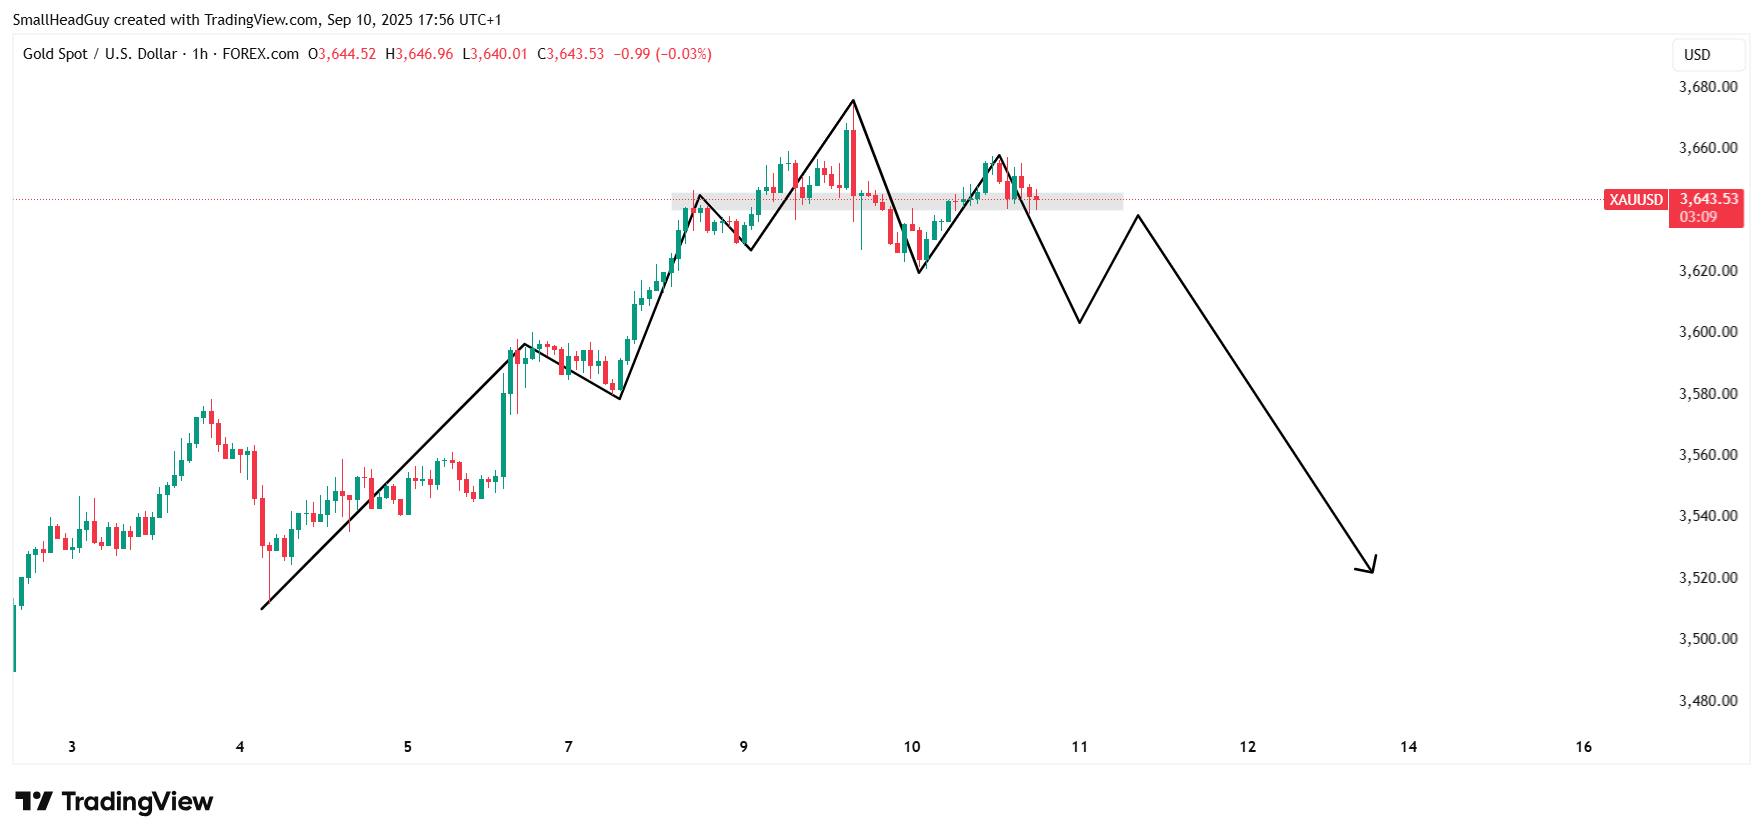
read more : Gold Price Forecast: Bearish Engulfing on 1-Hour Charts Heralds Pullback Toward $3,600 10 SEPTEMBER 2025