USDCHF Preparing for Bearish Move: Multi-Timeframe Analysis and Trading Outlook
Introduction to USDCHF Market Outlook
The USDCHF currency pair, representing the US dollar against the Swiss franc, is showing clear signs of preparing for a bearish move. Multi-timeframe analysis—daily, 4-hour, and 1-hour charts—confirms that sellers are regaining control. Price action across these charts reveals a completed retracement phase, supported by Fibonacci levels, suggesting that downside continuation is the most likely scenario.
This article provides a detailed breakdown of the bearish setup, explains the technical confirmation, and offers a structured trading plan for USDCHF traders.
Daily Time Frame: Complete Bearish Market Structure
Why the Daily Chart Confirms Bearish Sentiment
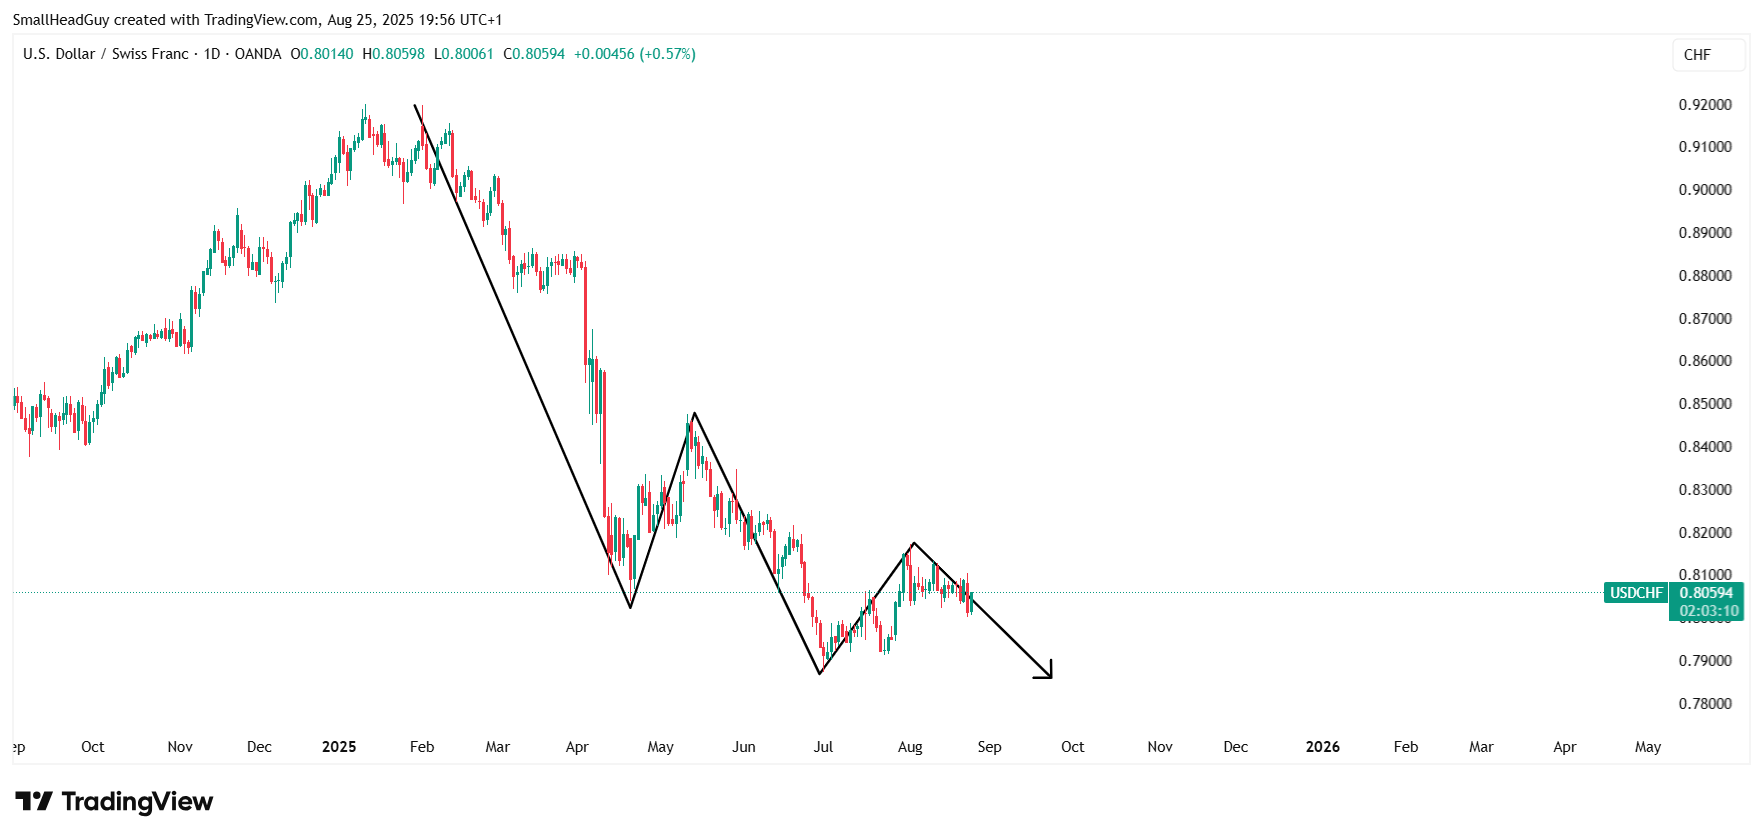
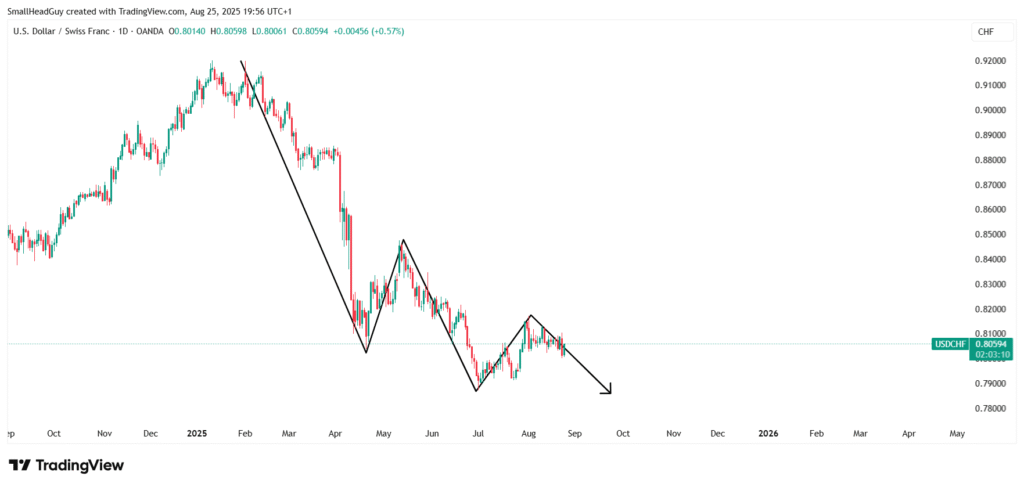
On the daily timeframe, USDCHF has established a complete bearish structure. Lower highs and lower lows dominate the chart, reinforcing that the overall trend favors sellers. This alignment with broader market momentum suggests further downside continuation.
Role of Retracement Before Continuation
Although the pair was in a bearish trajectory, traders anticipated a small retracement to the upside before continuation. Such pullbacks are normal in trending markets and provide opportunities for sellers to re-enter at higher levels with better risk-to-reward ratios.
4-Hour Time Frame: Retracement Completed
Fibonacci Retracement Confirmation
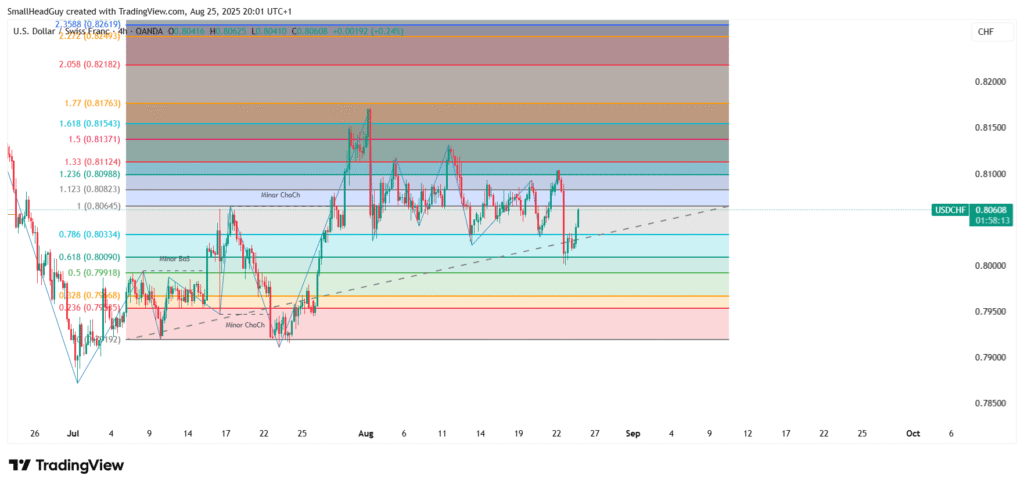
On the 4-hour chart, the anticipated retracement has now been completed successfully. Price respected Fibonacci retracement levels, reinforcing the bearish continuation outlook. Traders use these retracement levels to validate that corrective moves are temporary and align with the broader trend.
Price Action Showing Exhaustion of Buyers
Candle formations on the 4-hour chart indicate a loss of bullish momentum. Sellers have stepped in around Fibonacci resistance zones, further confirming that retracement has ended and the bearish move is ready to resume.
1-Hour Time Frame: Key Bearish Confirmation Levels
Retracement Completion at Fibonacci Zones
The 1-hour chart provides a granular view of the retracement phases. Just like on the higher timeframes, Fibonacci levels have guided price action. Retracements completed on this chart add further confirmation to the bearish bias.
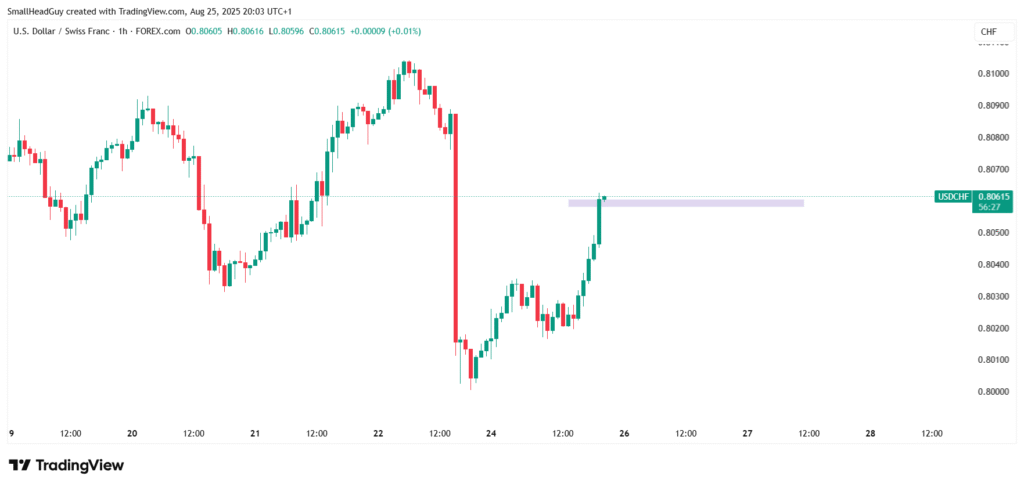
Key Bearish Trigger at 0.80600
The most critical level on the 1-hour timeframe is 0.80600. This level coincides with a Fibonacci mark, and price trading below 0.80600 with bearish candle confirmation would be the clearest signal to enter short positions.
Downside Target at 0.79600
The first significant downside target is 0.79600, another Fibonacci level. If price breaks and sustains below 0.80600, this level becomes the logical profit target for short trades.
Fibonacci Analysis Supporting Bearish Outlook
Importance of Fibonacci Retracement in Confirming Pullbacks
Fibonacci retracement levels are essential for identifying temporary pullbacks within trends. In this case, USDCHF retraced to Fibonacci zones on daily, 4-hour, and 1-hour charts, all aligning with a bearish continuation outlook.
Fibonacci Extension Levels for Bearish Targets
Beyond 0.79600, further Fibonacci extension levels may provide additional downside targets. Traders should monitor these levels for potential continuation mov
Trading Plan for USDCHF Bearish Move
Entry Strategy Below 0.80600
The recommended entry strategy is to wait for price to close below 0.80600 with a confirmed bearish candlestick pattern. This avoids premature entries and reduces false breakout risks.
Stop-Loss and Risk Management
A stop-loss can be placed just above the retracement high, ensuring controlled risk. Risk should be kept under 2% per trade to preserve capital in volatile market conditions.
Profit Targets at Key Fibonacci Levels
- First target: 0.79600
- Extended target: Below 0.79000 if bearish momentum accelerates
Scaling out profits as price approaches key Fibonacci targets allows traders to lock in gains while managing risk.
Conclusion: The Outlook for USDCHF Preparing for Bearish Move
Multi-timeframe analysis shows that USDCHF is preparing for a bearish move. The daily chart confirms a strong bearish structure, the 4-hour chart signals a completed retracement, and the 1-hour chart highlights a critical entry trigger at 0.80600. With downside targets at 0.79600, traders should watch for bearish confirmation patterns before entering short positions.