Introduction to USDCHF Market Update
The USDCHF currency pair continues to show weakness across multiple timeframes. Technical analysis on the daily, 4-hour, and 1-hour charts confirms a bearish structure that aligns with the broader market outlook. Following our last forecast, USDCHF respected resistance levels and initiated a significant sell-off, bringing downside targets back into focus.

Recap of Previous USDCHF Forecast
Bearish Bias Highlighted at 0.80600
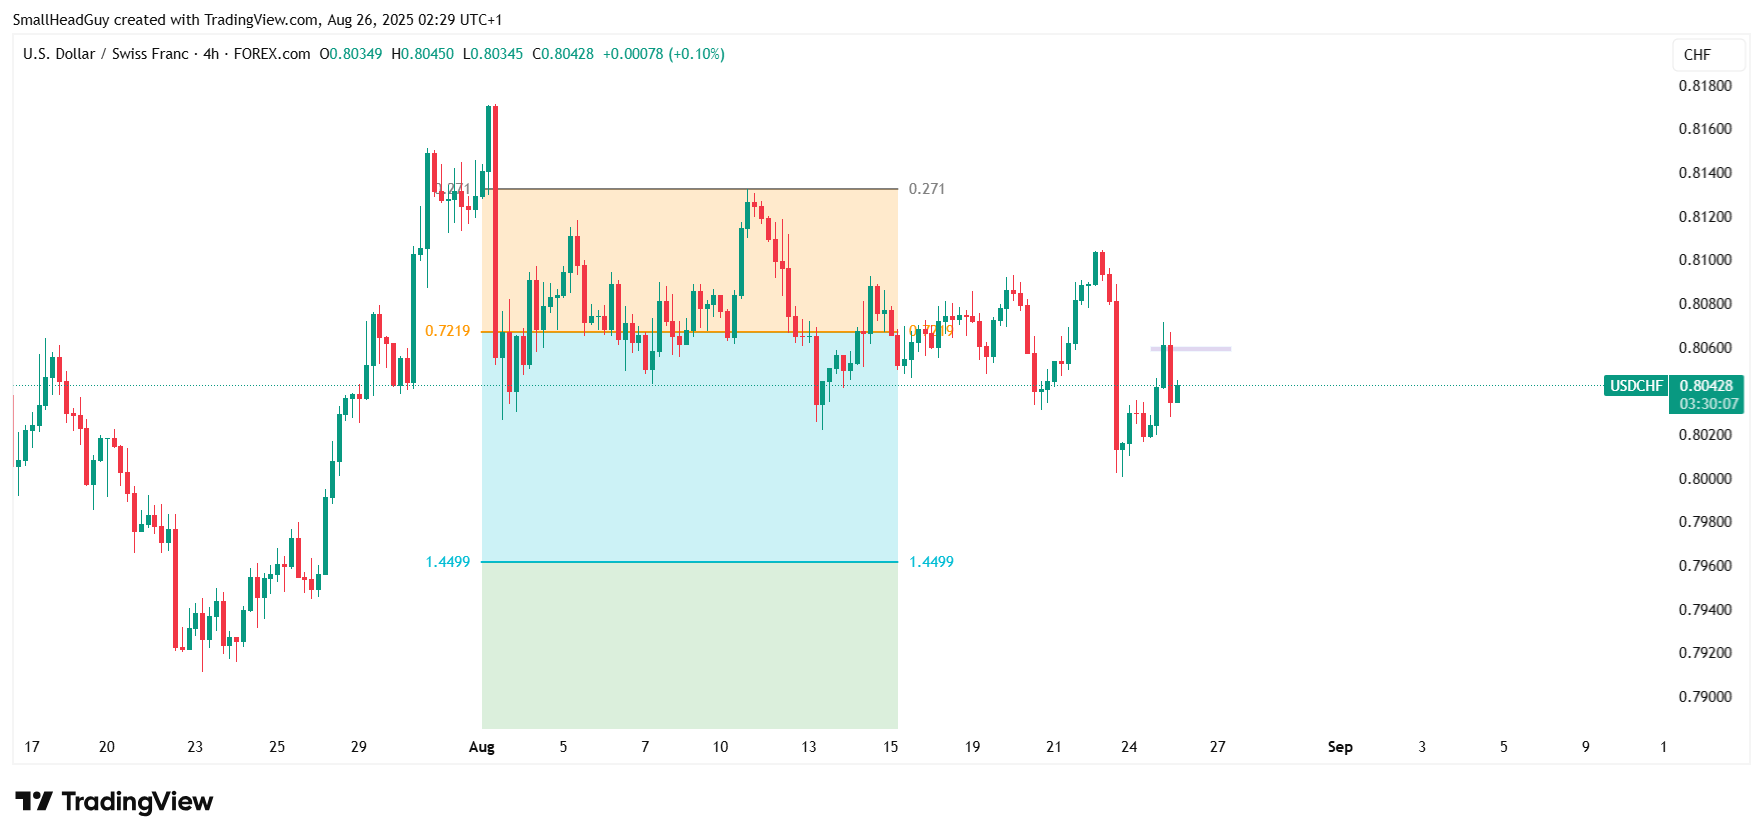
In the previous forecast, USDCHF was trading around 0.80600, a key resistance zone identified as a potential turning point. At that time, the market structure was already showing bearish tendencies, and a breakdown was anticipated.
Expected Sell-Off Confirmed
Since then, price has consistently traded below 0.80600 and delivered a strong bearish move as expected. This confirms the bearish bias and validates the technical setup shared in our earlier analysis.
Current USDCHF Market Structure
Daily Timeframe Showing Bearish Continuation
On the daily chart, USDCHF is locked in a bearish structure of lower highs and lower lows. This alignment reflects strong selling pressure and adds confidence to downside projections.
4-Hour Timeframe Confirms Bearish Momentum
The 4-hour chart confirms that sellers remain in control. Price action continues to reject higher levels, and candlestick formations highlight strong downward momentum.
1-Hour Timeframe Aligning with Overall Trend
The 1-hour chart mirrors the broader bearish bias. Short-term retracements are being capped by Fibonacci levels, reinforcing the expectation of further downside.
Key Downside Targets for USDCHF
First Target at 0.79600 (Fibonacci Support)
The immediate downside objective is 0.79600, a Fibonacci level that aligns with previous structural support. If sellers sustain momentum, this target is likely to be tested in the short term.
Extended Target at 0.77900 (Fibonacci Zone)
If bearish continuation persists beyond 0.79600, the next major Fibonacci level sits at 0.77900. This would represent a deeper corrective move and a high-probability area for profit-taking.
Trading Strategy and Risk Management
Ideal Short Entries Below Resistance
As long as USDCHF remains below 0.80600, traders should favor short positions. Retracements back toward resistance zones can provide fresh entry opportunities.
Stop-Loss Placement Above 0.80600
Stop-loss orders should be kept above 0.80600 to protect against unexpected bullish reversals. This ensures risk remains controlled even if the market shifts.
Managing Positions Across Fibonacci Targets
- Partial profits can be secured at 0.79600
- Remaining positions can be held toward 0.77900
- Trailing stops are recommended to lock in gains while allowing room for continuation
Common Mistakes to Avoid
- Entering short positions without confirmation from bearish candle patterns
- Overleveraging during volatile sessions
- Ignoring higher timeframe market structure when trading intraday setups
Conclusion: USDCHF Bearish Price Forecast
USDCHF continues to trade within a strong bearish structure across all major timeframes. The confirmed rejection at 0.80600 has already triggered a significant sell-off, with immediate targets set at 0.79600 and extended downside toward 0.77900. Traders should manage positions carefully, using Fibonacci levels as guides for entries, stop-loss placement, and profit-taking strategies.